目录
前言
一. 环境准备
二. 实施部署
三. 安装配置head监控插件 (只在第一台es部署)
四. Kibana部署(当前还是在第一台es部署)
五. 安装配置Nginx反向代理
六. Logstash部署与测试
前言
1. Elasticsearch:
是一个基于Lucene的搜索服务器。提供搜集、分析、存储数据三大功能。它提供了一个分布式多用户能力的全文搜索引擎,基于RESTful web接口。Elasticsearch是用Java开发的,并作为Apache许可条款下的开放源码发布,是当前流行的企业级搜索引擎。设计用于云计算中,能够达到实时搜索,稳定,可靠,快速,安装使用方便。
2. Logstash:
主要是用来日志的搜集、分析、过滤日志的工具。用于管理日志和事件的工具,你可以用它去收集日志、转换日志、解析日志并将他们作为数据提供给其它模块调用,例如搜索、存储等。
3. Kibana:
是一个优秀的前端日志展示框架,它可以非常详细的将日志转化为各种图表,为用户提供强大的数据可视化支持,它能够搜索、展示存储在 Elasticsearch 中索引数据。使用它可以很方便的用图表、表格、地图展示和分析数据。
4. Kafka:
数据缓冲队列。作为消息队列解耦合处理过程,同时提高了可扩展性。具有峰值处理能力,使用消息队列能够使关键组件顶住突发的访问压力,而不会因为突发的超负荷的请求而完全崩溃。
-
1.发布和订阅记录流,类似于消息队列或企业消息传递系统。
-
2.以容错持久的方式存储记录流。
-
3.处理记录发生的流。
5. Filebeat:
隶属于Beats,轻量级数据收集引擎。基于原先 Logstash-fowarder 的源码改造出来。换句话说:Filebeat就是新版的 Logstash-fowarder,也会是 ELK Stack 在 Agent 的第一选择,目前Beats包含四种工具:
-
1.Packetbeat(搜集网络流量数据)
-
2.Metricbeat(搜集系统、进程和文件系统级别的 CPU 和内存使用情况等数据。通过从操作系统和服务收集指标,帮助您监控服务器及其托管的服务。)
-
3.Filebeat(搜集文件数据)
-
4.Winlogbeat(搜集 Windows 事件日志数据)
一. 环境准备
本篇实验所对应插件或一些安装包可以在我网盘下载
Elasticsearch: 7.13.2
Logstash: 7.13.2
Kibana: 7.13.2
Kafka: 2.11-1
Filebeat: 7.13.2
链接:https://pan.baidu.com/s/1GB10KvIaovzXWCl528XZnA?pwd=yhxh
提取码:yhxh
准备四台虚拟机参照如下配置并进行初始化操作
| 软件版本 | 主机名 | IP | 系统 | 系统配置 |
| elasticsearch-7.13.2.tar.gz | es1 | 192.168.226.20 | Rocky_linux9.4 | 2核5G |
| elasticsearch-7.13.2.tar.gz | es2 | 192.168.226.21 | Rocky_linux9.4 | 2核4G |
| elasticsearch-7.13.2.tar.gz | es3 | 192.168.226.22 | Rocky_linux9.4 | 2核4G |
修改主机名
#对192.168.226.20主机操作
[root@localhost ~]# hostnamectl set-hostname es1

#对192.168.226.21主机操作
[root@localhost ~]# hostnamectl set-hostname es2

#对192.168.226.22主机操作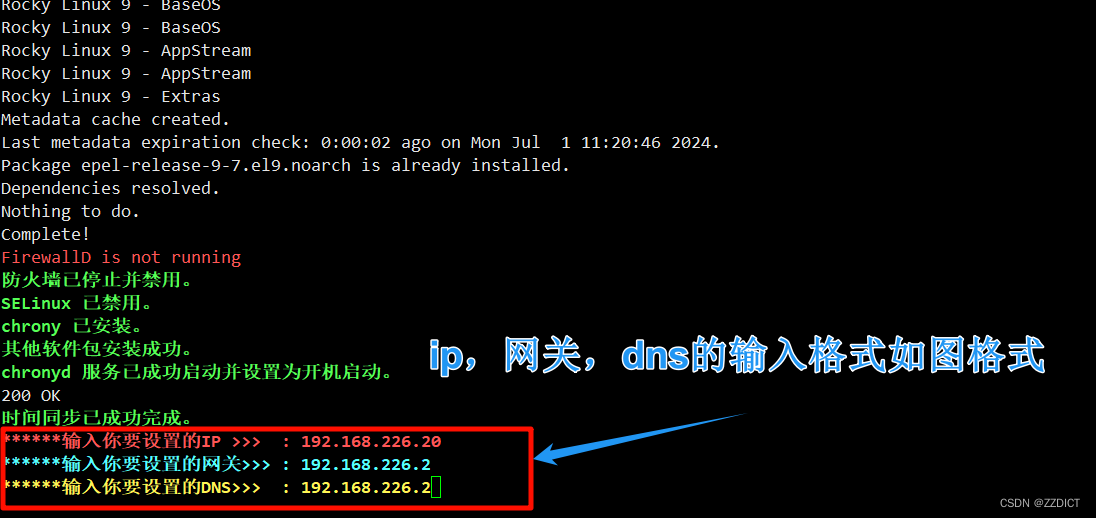
[root@localhost ~]# hostnamectl set-hostname es3关闭防火墙和selinux,进行时间同步,IP固定,这里附上初始化脚本,其中ip和网关,dns输入格式参考如下图所示,执行完脚本后会重启主机:
#!/bin/bash
if [ "$(id -u)" -ne 0 ]; then
  tput bold
  tput setaf 1
  tput setaf 3
  echo "请以 root 用户运行此脚本。"
  tput sgr0
  exit 1
fi

# 启用网络接口
enable_network_interface() {
  local interface=$1
  if ip link set "$interface" up; then
    tput bold
	tput setaf 2
    echo "网络接口 $interface 已启用。"
	tput sgr0
  else
    tput bold
	tput setaf 1
    echo "无法启用网络接口 $interface,请检查接口名称。"
	tput sgr0
    exit 1
  fi
}

# 配置 YUM 源
configure_yum_repos() {
  sed -e 's|^mirrorlist=|#mirrorlist=|g' \
      -e 's|^#baseurl=http://dl.rockylinux.org/$contentdir|baseurl=https://mirrors.aliyun.com/rockylinux|g' \
      -i.bak \
      /etc/yum.repos.d/Rocky-*.repo
  tput bold
  tput setaf 2
  echo "YUM 源配置已更新。"
  tput sgr0
  dnf makecache
  yum -y install epel-release
}

# 停止和禁用防火墙,禁用 SELinux
configure_security() {
  systemctl stop firewalld && systemctl disable firewalld
  firewall-cmd --reload
  tput bold
  tput setaf 2
  echo "防火墙已停止并禁用。"
  tput sgr0
  sed -i 's/SELINUX=enforcing/SELINUX=disabled/' /etc/selinux/config
  tput bold
  tput setaf 2
  echo "SELinux 已禁用。"
  tput sgr0
}

# 检查并安装chrony,进行时间同步
function install_and_sync_time_with_chrony() {
    # 检查是否已经安装chrony
    if ! command -v chronyd &>/dev/null; then
        sudo dnf install -y chrony &> /dev/null
        # 检查安装是否成功
        if ! command -v chronyd &>/dev/null; then
            tput bold
            tput setaf 1
            echo "安装 chrony 失败。请检查您的包管理器并重试。"
            tput sgr0
            exit 1
        else
            tput bold
            tput setaf 2
            echo "chrony 安装成功。"
            tput sgr0
        fi
    else
        tput bold
        tput setaf 2
        echo "chrony 已安装。"
        tput sgr0
    fi

    # 确保安装其他必要的软件包
    sudo dnf install -y vim wget unzip tar lrzsz &> /dev/null
    if [ $? -eq 0 ]; then
        tput bold
        tput setaf 2
        echo "其他软件包安装成功。"
        tput sgr0
    else
        tput bold
        tput setaf 1
        echo "安装其他软件包失败。"
        tput sgr0
        exit 1
    fi


    # 启动 chronyd 服务并启用开机启动
    if sudo systemctl start chronyd && sudo systemctl enable chronyd; then
        tput bold
        tput setaf 2
		echo "chronyd 服务已成功启动并设置为开机启动。"
		tput sgr0
    else
		tput bold
		tput setaf 1
        echo "启动或启用 chronyd 服务失败。请检查 systemctl 状态。"
		tput sgr0
        exit 1
    fi

    # 强制同步时间
    sudo chronyc -a makestep
	tput bold
    tput setaf 2
    echo "时间同步已成功完成。"
	tput sgr0
}


# 自定义 IP 地址
configure_ip_address() {
  tput bold
  tput blink
  tput setaf 1
  read -p "******输入你要设置的IP >>>  : " ip_a
  tput sgr0
  tput bold
  tput blink
  tput setaf 6
  read -p "******输入你要设置的网关>>> : " gat
  tput sgr0
  tput bold
  tput blink
  tput setaf 3
  read -p "******输入你要设置的DNS>>>  : " dnns
  tput sgr0

  # 判断当前连接的名字
  connection_name=$(nmcli -t -f NAME,DEVICE con show --active | grep -E "ens33|Wired connection 1" | cut -d: -f1)

  if [[ "$connection_name" == "ens33" ]]; then
    # 针对 ens33 连接进行配置
    nmcli con mod "ens33" ipv4.method manual ipv4.addresses "${ip_a}/24" ipv4.gateway "${gat}" ipv4.dns "${dnns}" autoconnect yes
  elif [[ "$connection_name" == "Wired connection 1" ]]; then
    # 针对 Wired connection 1 连接进行配置
    nmcli con mod "Wired connection 1" ipv4.method manual ipv4.addresses "${ip_a}/24" ipv4.gateway "${gat}" ipv4.dns "${dnns}" autoconnect yes
  else
	tput bold
	tput setaf 1
    echo "无法识别的网络连接名称:$connection_name"
	tput sgr0
    return 1
  fi

  tput setab 5
  tput setaf 15
  tput bold
  echo "IP 地址配置成功,即将重启系统。"
  tput sgr0

  nmcli con up "$connection_name"
  reboot
}


# 主函数
main() {
  local interface="ens33"
  enable_network_interface "$interface"
  configure_yum_repos
  configure_security
  install_and_sync_time_with_chrony
  configure_ip_address "$interface"
}

# 调用主函数
main
二. 实施部署
1. 给三台主机创建普通用户叫es并修改密码也为es 因为Elasticsearch不可以root用户启动。
#在192.168.226.20主机操作
[root@es1 ~]# useradd es
[root@es1 ~]# echo es |passwd --stdin es

#在192.168.226.21主机操作
[root@es2 ~]# useradd es
[root@es2 ~]# echo es |passwd --stdin es


#在192.168.226.21主机操作
[root@es3 ~]# useradd es
[root@es3 ~]# echo es |passwd --stdin es
2. 给三台服务器配置域名解析,三台都要执行
[root@es1 ~]# cat <<EOF >> /etc/hosts
192.168.226.20 es1
192.168.226.21 es2
192.168.226.22 es3
EOF
3. 下载上传至三台服务器ES
官网下载历史版本Past Releases of Elastic Stack Software | Elastic
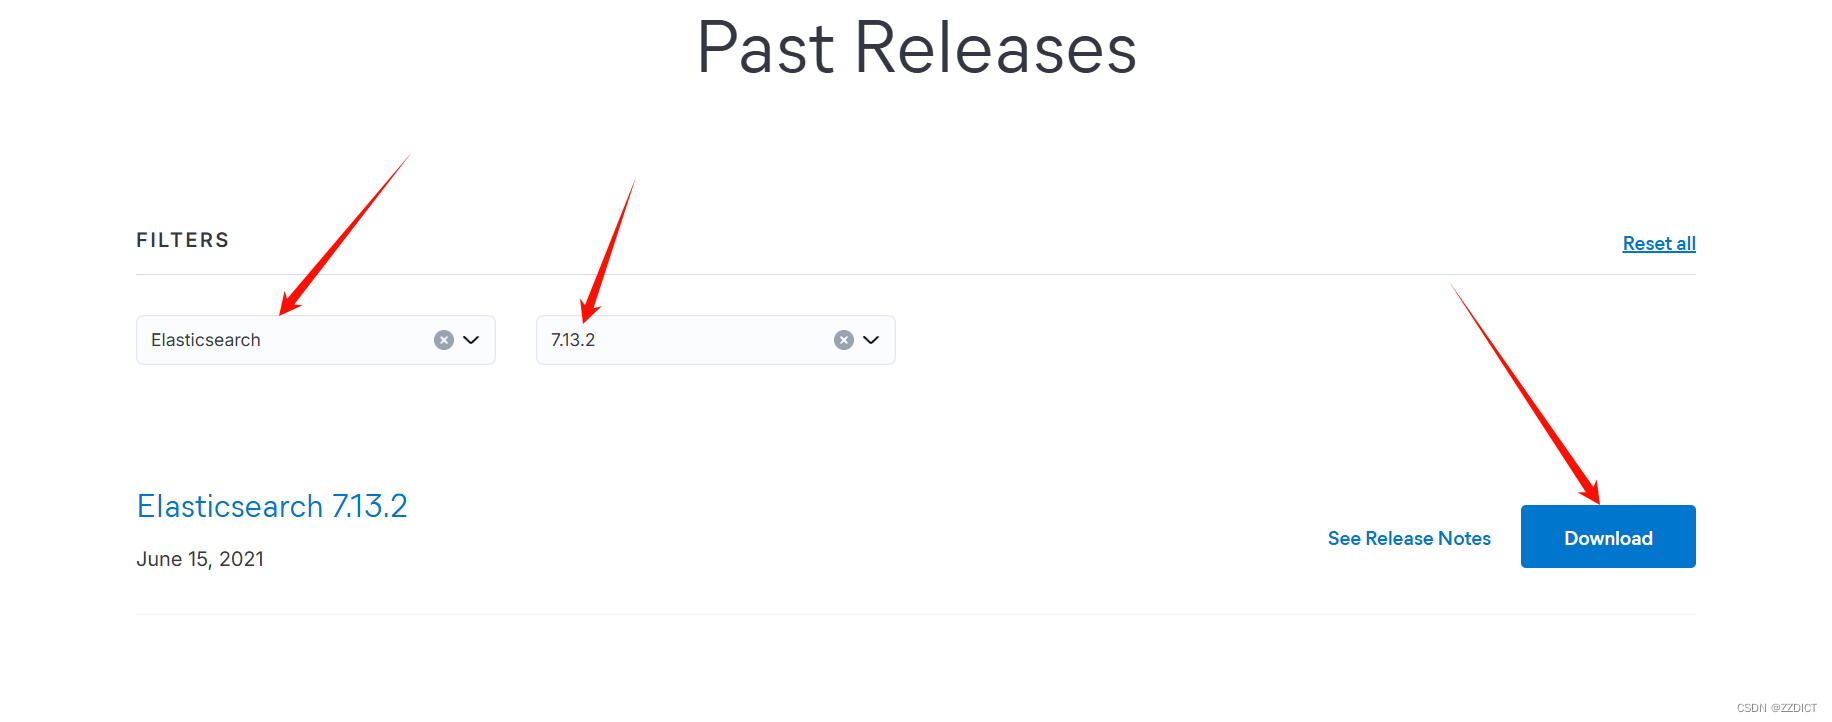
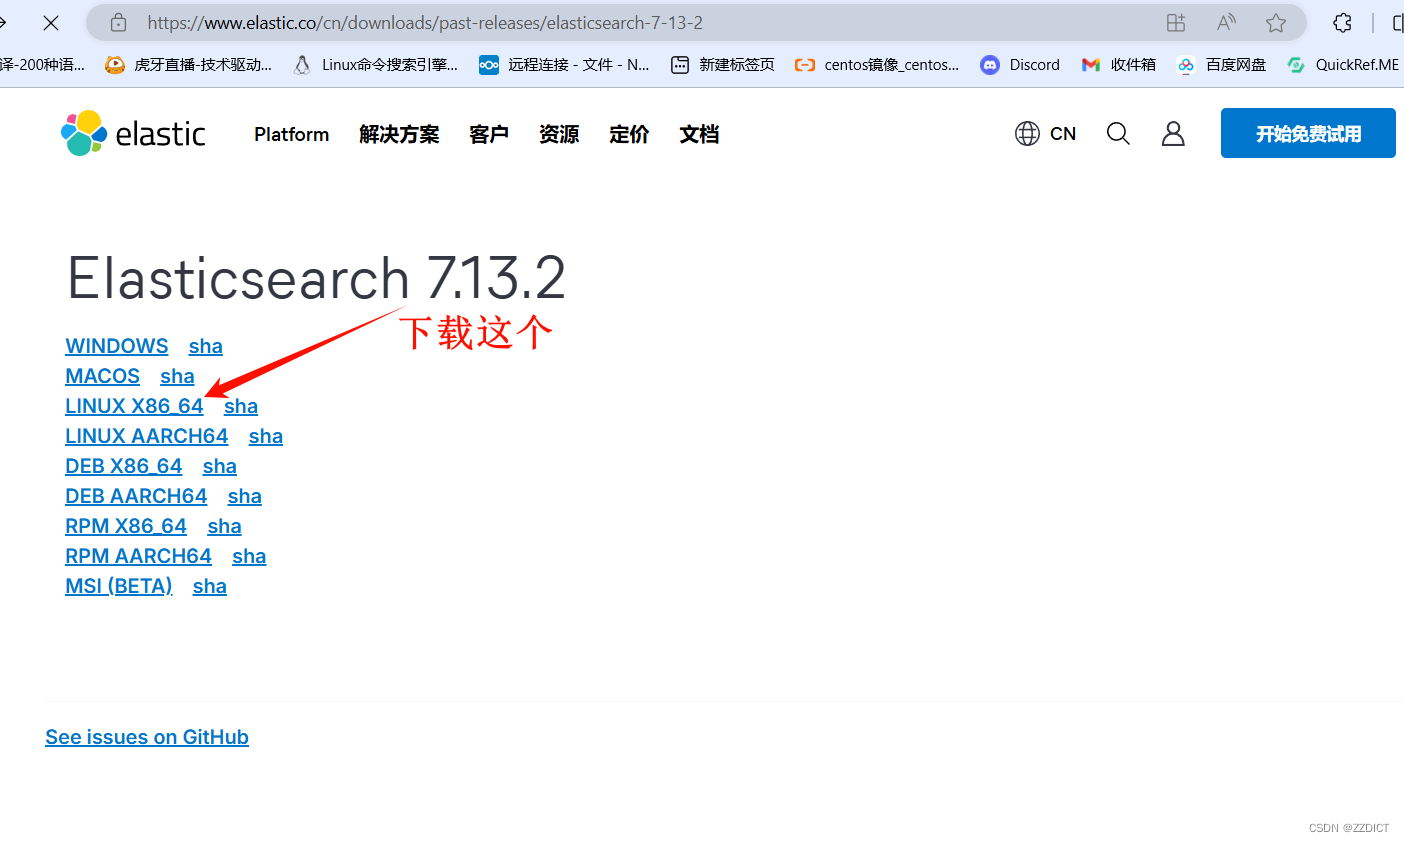
上传至三台服务器
4. 给三台服务器安装ES
[root@es1 ~]# yum install -y tar
[root@es1 ~]# tar zxvf elasticsearch-7.13.2-linux-x86_64.tar.gz -C /usr/local/
[root@es1 ~]# mv /usr/local/elasticsearch-7.13.2 /usr/local/es
5. 对三台服务配置文件修改
#对192.168.226.20操作,将该配置文件删除,使用下述配置内容
[root@es1 ~]# vim /usr/local/es/config/elasticsearch.yml
cluster.name: bjbpe01-elk
cluster.initial_master_nodes: ["192.168.226.20","es2","es3"] # 单节点模式这里的地址只填写本机地址,用IP或者主机名都可以写,但一定要有前面的域名解析操作
node.name: es01
node.master: true
node.data: true
path.data: /data/elasticsearch/data
path.logs: /data/elasticsearch/logs
bootstrap.memory_lock: false
bootstrap.system_call_filter: false
network.host: 0.0.0.0
http.port: 9200
transport.tcp.port: 9300
# 单节点模式下,将discovery开头的行注释
discovery.seed_hosts: ["es2","es3"]  #这里可以写IP或者主机名,主机名要做域名解析
discovery.zen.minimum_master_nodes: 2
discovery.zen.ping_timeout: 150s
discovery.zen.fd.ping_retries: 10
client.transport.ping_timeout: 60s
http.cors.enabled: true
http.cors.allow-origin: "*"
#对192.168.226.21操作,将该配置文件删除,使用下述配置内容
[root@es2 ~]# vim /usr/local/es/config/elasticsearch.yml
cluster.name: bjbpe01-elk
cluster.initial_master_nodes: ["192.168.226.20","es2","es3"] # 单节点模式这里的地址只填写本机地址,用IP或者主机名都可以写,但一定要有前面的域名解析操作
node.name: es02
node.master: true
node.data: true
path.data: /data/elasticsearch/data
path.logs: /data/elasticsearch/logs
bootstrap.memory_lock: false
bootstrap.system_call_filter: false
network.host: 0.0.0.0
http.port: 9200
transport.tcp.port: 9300
# 单节点模式下,将discovery开头的行注释
discovery.seed_hosts: ["es1","es3"] #这里可以写IP或者主机名,主机名要做域名解析
discovery.zen.minimum_master_nodes: 2
discovery.zen.ping_timeout: 150s
discovery.zen.fd.ping_retries: 10
client.transport.ping_timeout: 60s
http.cors.enabled: true
http.cors.allow-origin: "*"#对192.168.226.22操作,将该配置文件删除,使用下述配置内容
[root@es3 ~]# vim /usr/local/es/config/elasticsearch.yml
cluster.name: bjbpe01-elk
cluster.initial_master_nodes: ["192.168.226.20","es2","es3"] # 单节点模式这里的地址只填写本机地址,用IP或者主机名都可以写,但一定要有前面的域名解析操作
node.name: es03
node.master: true
node.data: true
path.data: /data/elasticsearch/data
path.logs: /data/elasticsearch/logs
bootstrap.memory_lock: false
bootstrap.system_call_filter: false
network.host: 0.0.0.0
http.port: 9200
transport.tcp.port: 9300
# 单节点模式下,将discovery开头的行注释
discovery.seed_hosts: ["es1","es2"] #这里可以写IP或者主机名,主机名要做域名解析
discovery.zen.minimum_master_nodes: 2
discovery.zen.ping_timeout: 150s
discovery.zen.fd.ping_retries: 10
client.transport.ping_timeout: 60s
http.cors.enabled: true
http.cors.allow-origin: "*"配置项含义:
cluster.name    集群名称,各节点配成相同的集群名称。
cluster.initial_master_nodes 集群ip,默认为空,如果为空则加入现有集群,第一次需配置
node.name       节点名称,各节点配置不同。
node.master     指示某个节点是否符合成为主节点的条件。
node.data       指示节点是否为数据节点。数据节点包含并管理索引的一部分。
path.data       数据存储目录。
path.logs       日志存储目录。
bootstrap.memory_lock       内存锁定,是否禁用交换,测试环境建议改为false。
bootstrap.system_call_filter    系统调用过滤器。
network.host    绑定节点IP。
http.port       rest api端口。
discovery.seed_hosts    提供其他 Elasticsearch 服务节点的单点广播发现功能,这里填写除了本机的其他ip
discovery.zen.minimum_master_nodes  集群中可工作的具有Master节点资格的最小数量,官方的推荐值是(N/2)+1,其中N是具有master资格的节点的数量。
discovery.zen.ping_timeout      节点在发现过程中的等待时间。
discovery.zen.fd.ping_retries        节点发现重试次数。
http.cors.enabled               是否允许跨源 REST 请求,用于允许head插件访问ES。
http.cors.allow-origin              允许的源地址。
6. 创建ES数据及日志存储目录,三台都操作
mkdir -p /data/elasticsearch/data
mkdir -p /data/elasticsearch/logs
7. 设置JVM堆大小 #7.0默认为4G ,三台都操作
sed -i 's/## -Xms4g/-Xms4g/' /usr/local/es/config/jvm.options
sed -i 's/## -Xmx4g/-Xmx4g/' /usr/local/es/config/jvm.options
注:我使用的笔记本只有16G内存,一般都后面都可以启动,如果实在带不动,就回到这一步改成3G的设置就可以了。
8. 修改安装目录及存储目录权限,三台都操作
chown -R es.es /data/elasticsearch
chown -R es.es /usr/local/es
9. 系统优化,这里对三台虚拟机都操作
(1)增加最大文件打开数
永久生效方法:
echo "* soft nofile 65536" >> /etc/security/limits.conf(2)增加最大进程数
echo "* soft nproc 65536" >> /etc/security/limits.conf* soft nofile 65536 * hard nofile 131072 * soft nproc 4096 * hard nproc 4096 更多的参数调整可以直接用这个
(3)增加最大内存映射数
echo "vm.max_map_count=262144" >> /etc/sysctl.conf
sysctl -p
启动如果报下列错误
memory locking requested for elasticsearch process but memory is not locked
elasticsearch.yml文件
bootstrap.memory_lock : false
/etc/sysctl.conf文件
vm.swappiness=0

错误:
max file descriptors [4096] for elasticsearch process is too low, increase to at least [65536]

意思是elasticsearch用户拥有的客串建文件描述的权限太低,知道需要65536个

解决:

切换到root用户下面,

[root@es1 ~]# vim /etc/security/limits.conf

在最后添加
* hard nofile 65536
* hard nproc 65536
重新启动elasticsearch,还是无效?
必须重新登录启动elasticsearch的账户才可以,例如我的账户名是elasticsearch,退出重新登录。
另外*也可以换为启动elasticsearch的账户也可以,* 代表所有,其实比较不合适

启动还会遇到另外一个问题,就是
max virtual memory areas vm.max_map_count [65530] is too low, increase to at least [262144]
意思是:elasticsearch用户拥有的内存权限太小了,至少需要262114。这个比较简单,也不需要重启,直接执行
sysctl -w vm.max_map_count=262144
就可以了
10. 三台虚拟机都切换到es用户,并且都启动elasticsearch
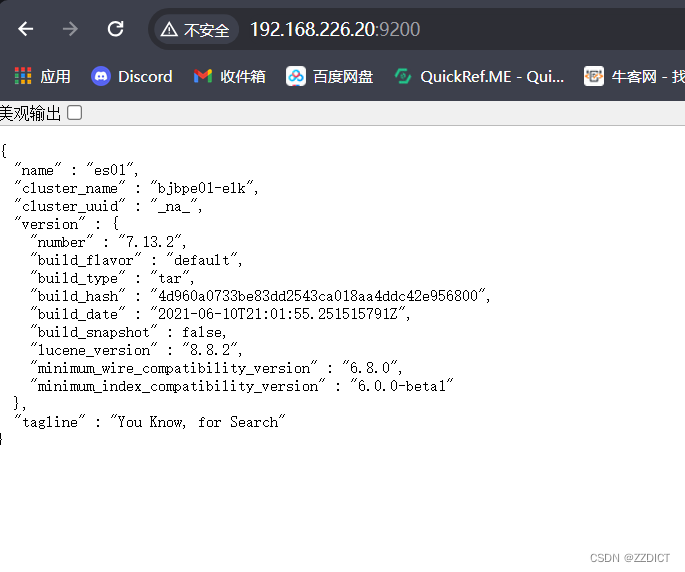
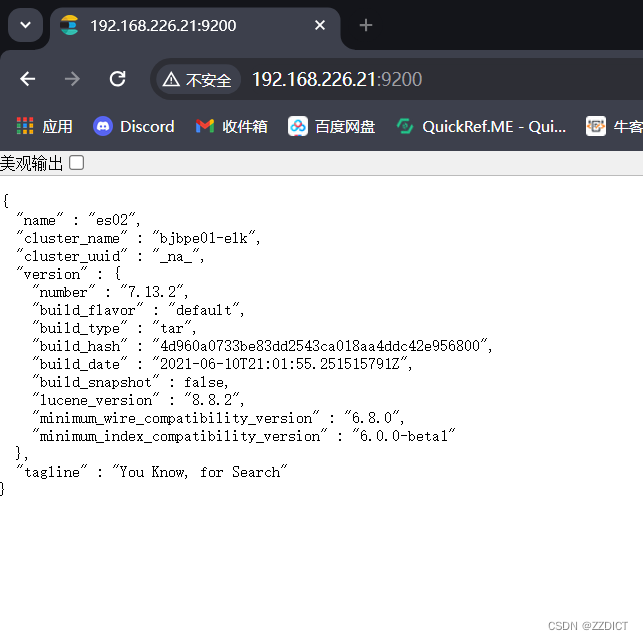
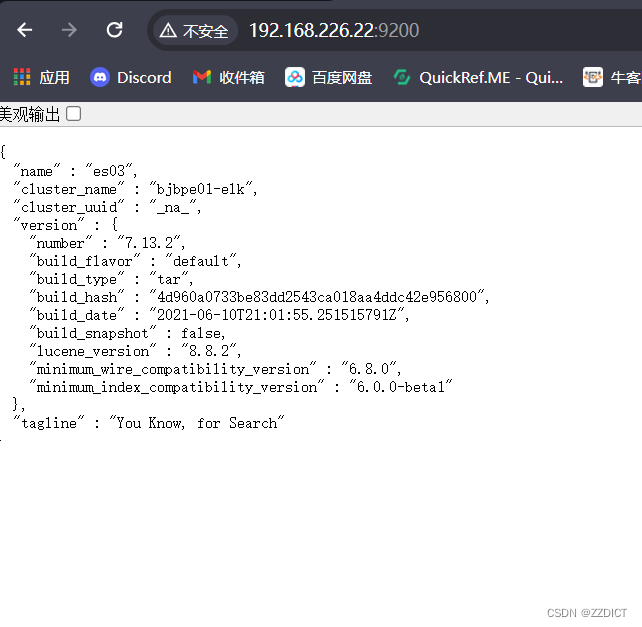
su es
cd /usr/local/es && nohup bin/elasticsearch &
浏览器访问IP加端口即可看到。
三. 安装配置head监控插件 (只在第一台es部署)
即对192.168.226.20操作
1. 安装node
上传node-v10.0.0-linux-x64.tar.gz包,这里我上传好了
[root@es1 ~]# ll
total 337828
-rw-------. 1 root root       815 Jun  6 14:00 anaconda-ks.cfg
-rw-r--r--  1 root root 327143940 Jul  1 03:16 elasticsearch-7.13.2-linux-x86_64.tar.gz
-rw-r--r--  1 root root  18772778 Jul  1 16:37 node-v10.0.0-linux-x64.tar.gz
-rw-r--r--  1 root root      4747 Jun 24 19:46 rocky_linux.sh
解压
[root@es1 ~]# tar -zxf node-v10.0.0-linux-x64.tar.gz -C /usr/local/[root@es1 local]# mv /usr/local/node-v10.0.0-linux-x64/ /usr/local/node
配置环境变量
[root@es1 ~]# echo "
NODE_HOME=/usr/local/node
PATH=\$NODE_HOME/bin:\$PATH
export NODE_HOME PATH
" >>/etc/profile
使配置文件生效
[root@es1 ~]# source /etc/profile查看版本号
[root@es1 ~]# node --version2. 下载head插件 ,在网盘有下载好的,可以上传使用
[root@es1 ~]# wget https://github.com/mobz/elasticsearch-head/archive/master.zip
[root@es1 ~]# yum install -y unzip
[root@es1 ~]# unzip -d /usr/local master.zip
3. 安装grunt
[root@es1 ~]# cd /usr/local/elasticsearch-head-master
[root@es1 elasticsearch-head-master]# npm install -g grunt-cli
[root@es1 elasticsearch-head-master]# grunt -version               #检查grunt版本号
4. 修改head源码
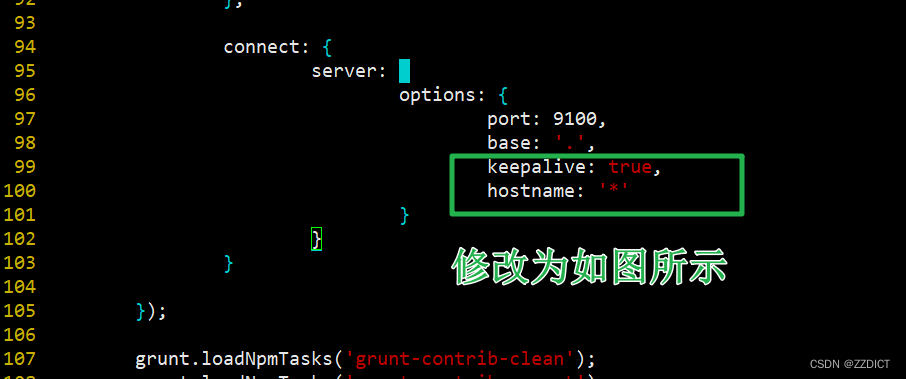
[root@es1 elasticsearch-head-master]# vi /usr/local/elasticsearch-head-master/Gruntfile.js +99修改为下图所示:
添加hostname: '*' 注意在上一行末尾添加逗号,hostname作为该模块最后一行不需要添加逗号
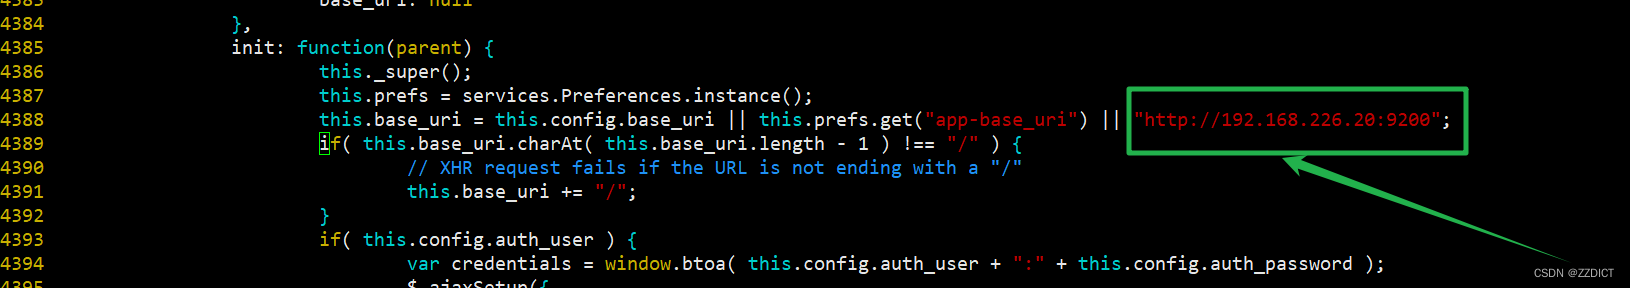
[root@es1 elasticsearch-head-master]# vim /usr/local/elasticsearch-head-master/_site/app.js +4388下图框选的原本是http://localhost:9200,需要将localhost修改成es1的IP地址 ,而用localhost,不然用浏览器访问会连接不到。
5. 下载head必要的文件,在网盘有下载好的,可以上传使用
[root@es1 ~]# wget https://github.com/Medium/phantomjs/releases/download/v2.1.1/phantomjs-2.1.1-linux-x86_64.tar.bz2 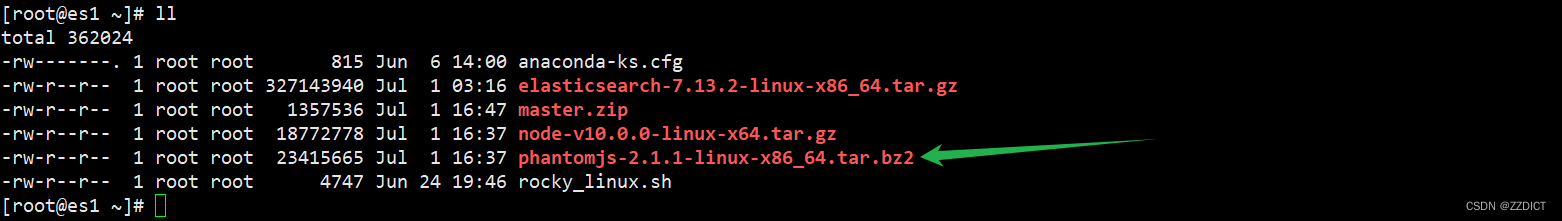
[root@es1 ~]# yum -y install bzip2
[root@es1 ~]# mkdir /tmp/phantomjs
[root@es1 ~]# mv phantomjs-2.1.1-linux-x86_64.tar.bz2 /tmp/phantomjs/
[root@es1 ~]# chmod 777 /tmp/phantomjs -R
6. 运行head
[root@es1 ~]# cd /usr/local/elasticsearch-head-master/
[root@es1 elasticsearch-head-master]# npm install phantomjs-prebuilt@2.1.16 --ignore-scripts
[root@es1 elasticsearch-head-master]# npm install      #需要等一会执行
[root@es1 elasticsearch-head-master]# nohup grunt server &
[root@es1 elasticsearch-head-master]# ss -tnlp
State         Recv-Q        Send-Q               Local Address:Port               Peer Address:Port       Process
LISTEN        0             128                        0.0.0.0:22                      0.0.0.0:*           users:(("sshd",pid=820,fd=3))
LISTEN        0             511                              *:9100                          *:*           users:(("grunt",pid=2283,fd=10))
LISTEN        0             4096                             *:9200                          *:*           users:(("java",pid=1716,fd=331))
LISTEN        0             128                           [::]:22                         [::]:*           users:(("sshd",pid=820,fd=4))
LISTEN        0             4096                             *:9300                          *:*           users:(("java",pid=1716,fd=277))
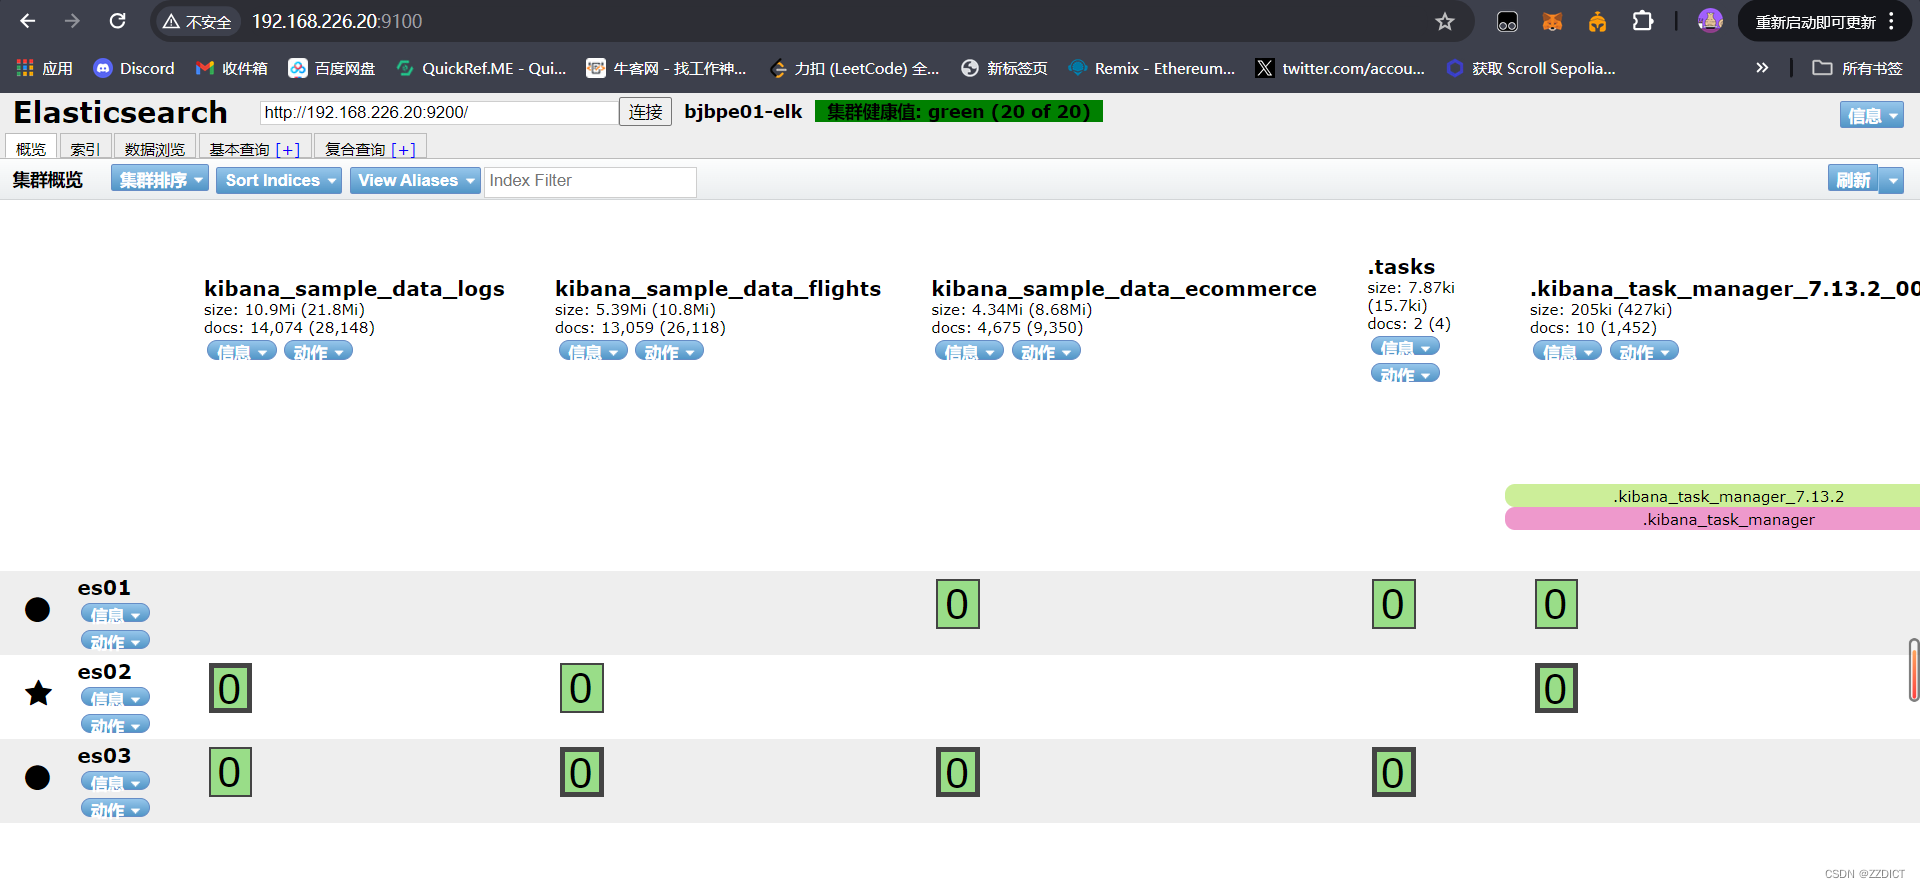
访问http://192.168.226.20:9100/
elasticsearch-head插件是Elasticsearch中一个常用的Web界面插件,用于管理和监控Elasticsearch集群的状态。
其中带信号图标的是master,这时选举产生的,不是默认指定的。 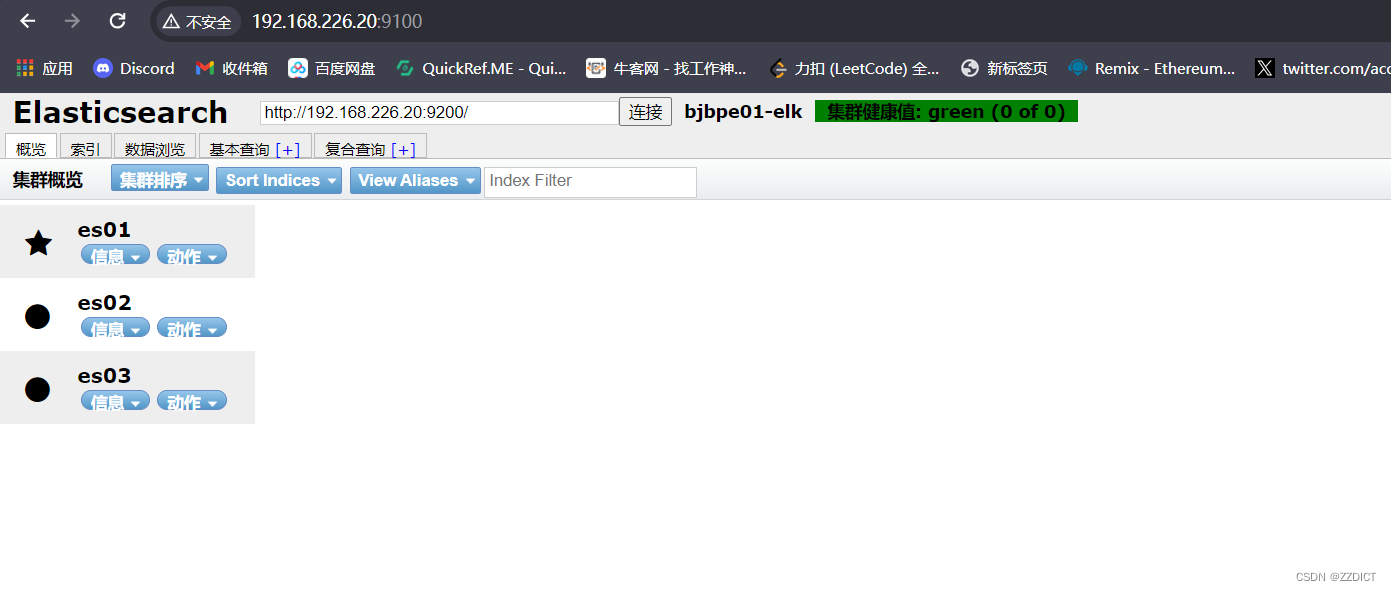
四. Kibana部署(当前还是在第一台es部署)
即对192.168.226.20操作
1. 安装配置Kibana
上传kibana-7.13.2-linux-x86_64.tar.gz,这里我上传好了
[root@es1 ~]# ll
total 298748
-rw-------. 1 root root       815 Jun  6 14:00 anaconda-ks.cfg
-rw-r--r--  1 root root 305904726 Jul  1 17:25 kibana-7.13.2-linux-x86_64.tar.gz
-rw-r--r--  1 root root      4747 Jun 24 19:46 rocky_linux.sh
[root@es1 ~]# tar zxf kibana-7.13.2-linux-x86_64.tar.gz -C /usr/local/2. 配置
[root@es1 ~]# echo '
server.port: 5601
server.host: "192.168.226.20"
elasticsearch.hosts: ["http://192.168.226.20:9200","http://192.168.226.21:9200","http://192.168.226.22:9200"]
kibana.index: ".kibana"
i18n.locale: "zh-CN"
'>>/usr/local/kibana-7.13.2-linux-x86_64/config/kibana.yml
配置项含义:
server.port kibana服务端口,默认5601
server.host kibana主机IP地址,即当前主机用的kibana的IP
elasticsearch.url   用来做查询的ES节点的URL,可以写多个,上面我写成IP,写主机名需要做本地域名解析。
kibana.index        kibana在Elasticsearch中使用索引来存储保存的searches, visualizations和dashboards,默认.kibana
3. 启动
[root@es1 ~]# cd /usr/local/kibana-7.13.2-linux-x86_64/
[root@es1 kibana-7.13.2-linux-x86_64]# nohup ./bin/kibana --allow-root &
[root@es1 kibana-7.13.2-linux-x86_64]# ss -tnlp
State Recv-Q Send-Q Local Address:Port Peer Address:Port Process
LISTEN 0 128 0.0.0.0:22 0.0.0.0:* users:(("sshd",pid=820,fd=3))
LISTEN 0 511 192.168.226.20:5601 0.0.0.0:* users:(("node",pid=2550,fd=18))
LISTEN 0 511 *:9100 *:* users:(("grunt",pid=2299,fd=10))
LISTEN 0 4096 *:9200 *:* users:(("java",pid=1716,fd=331))
LISTEN 0 128 [::]:22 [::]:* users:(("sshd",pid=820,fd=4))
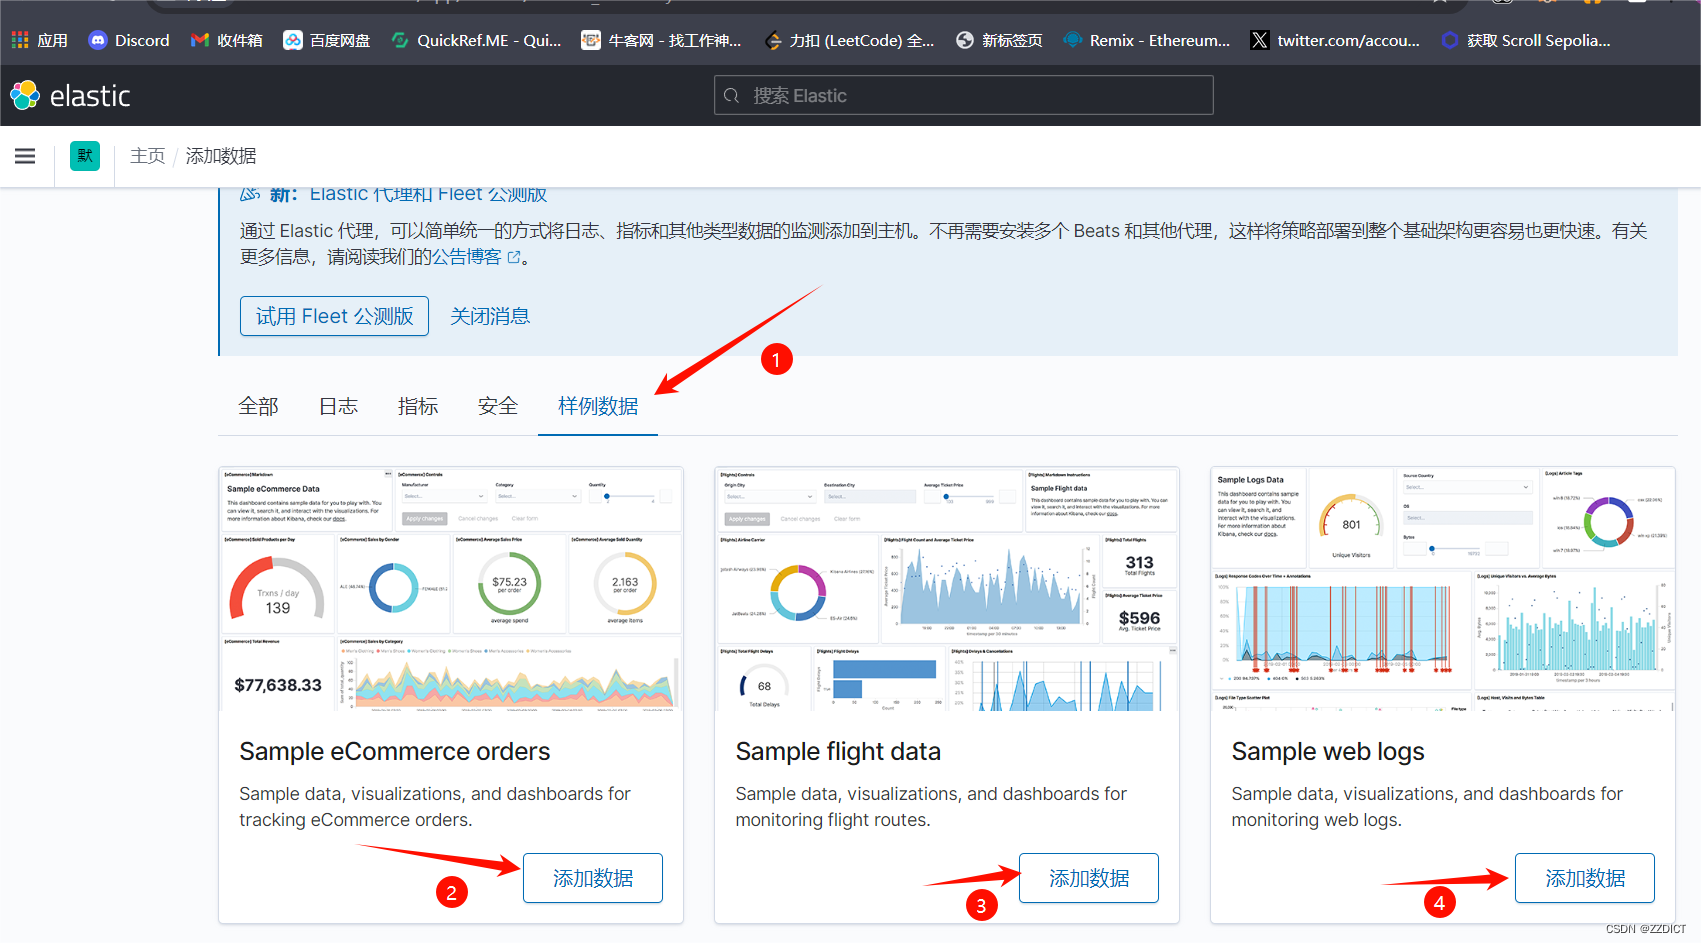
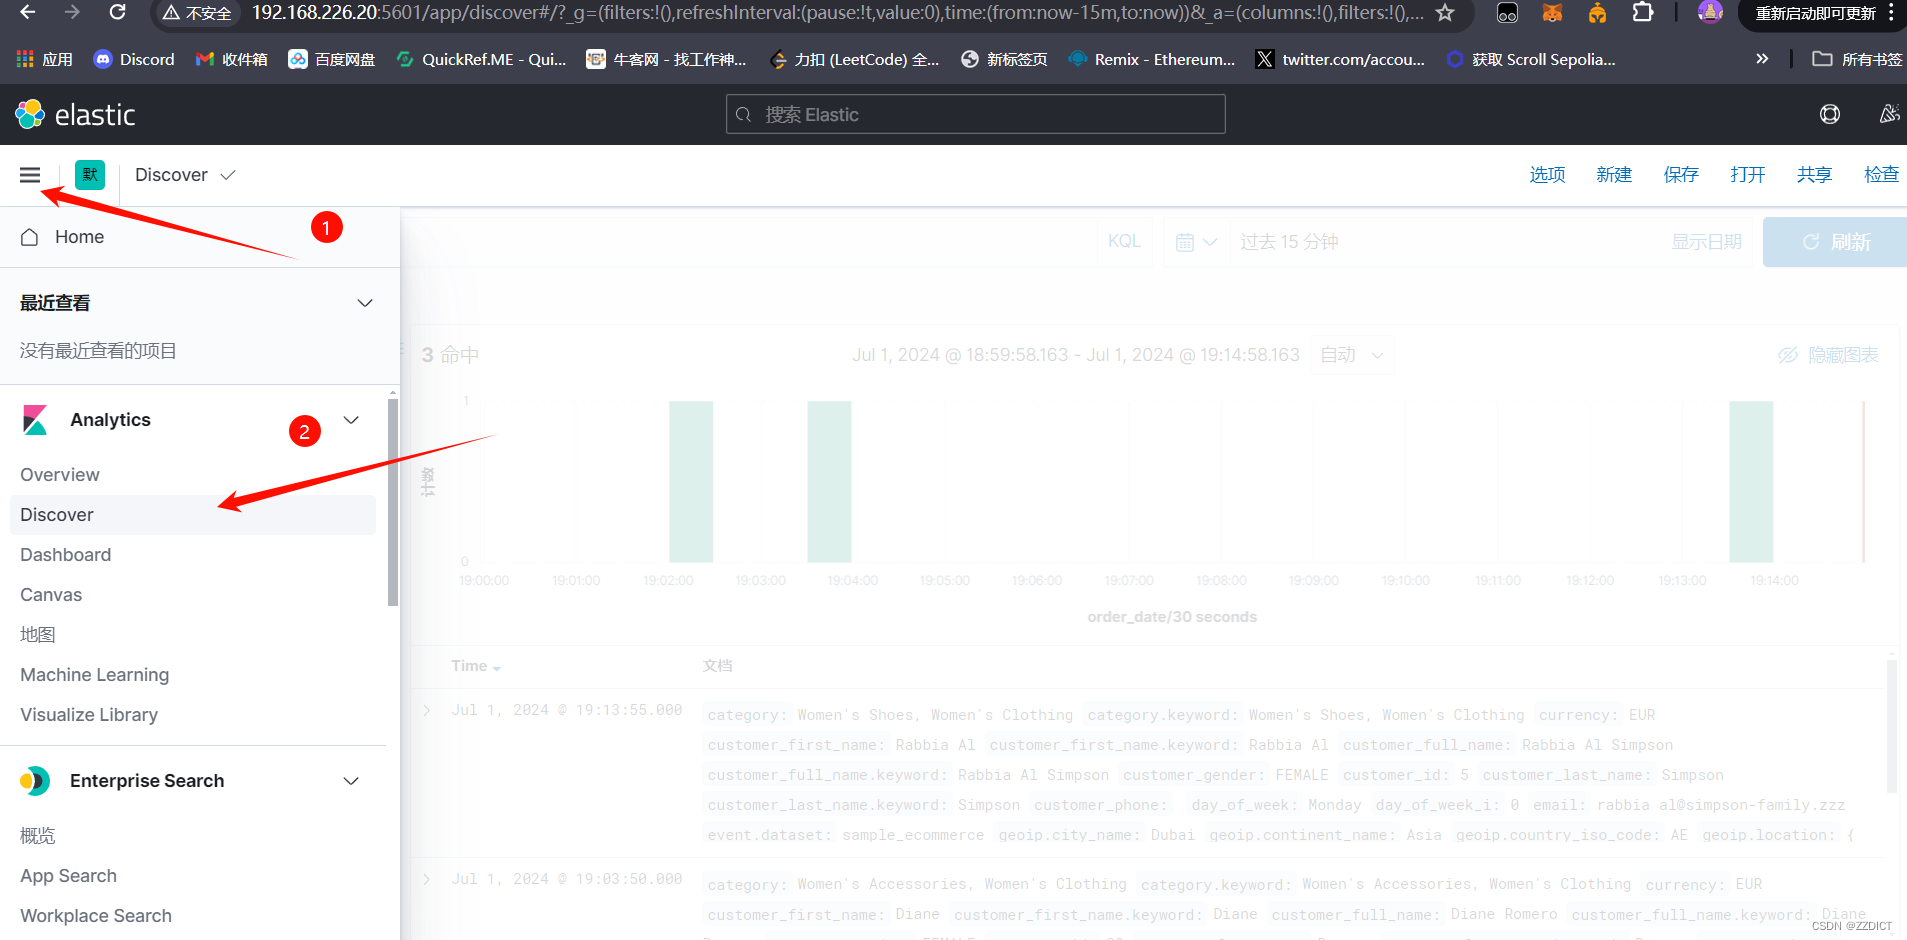
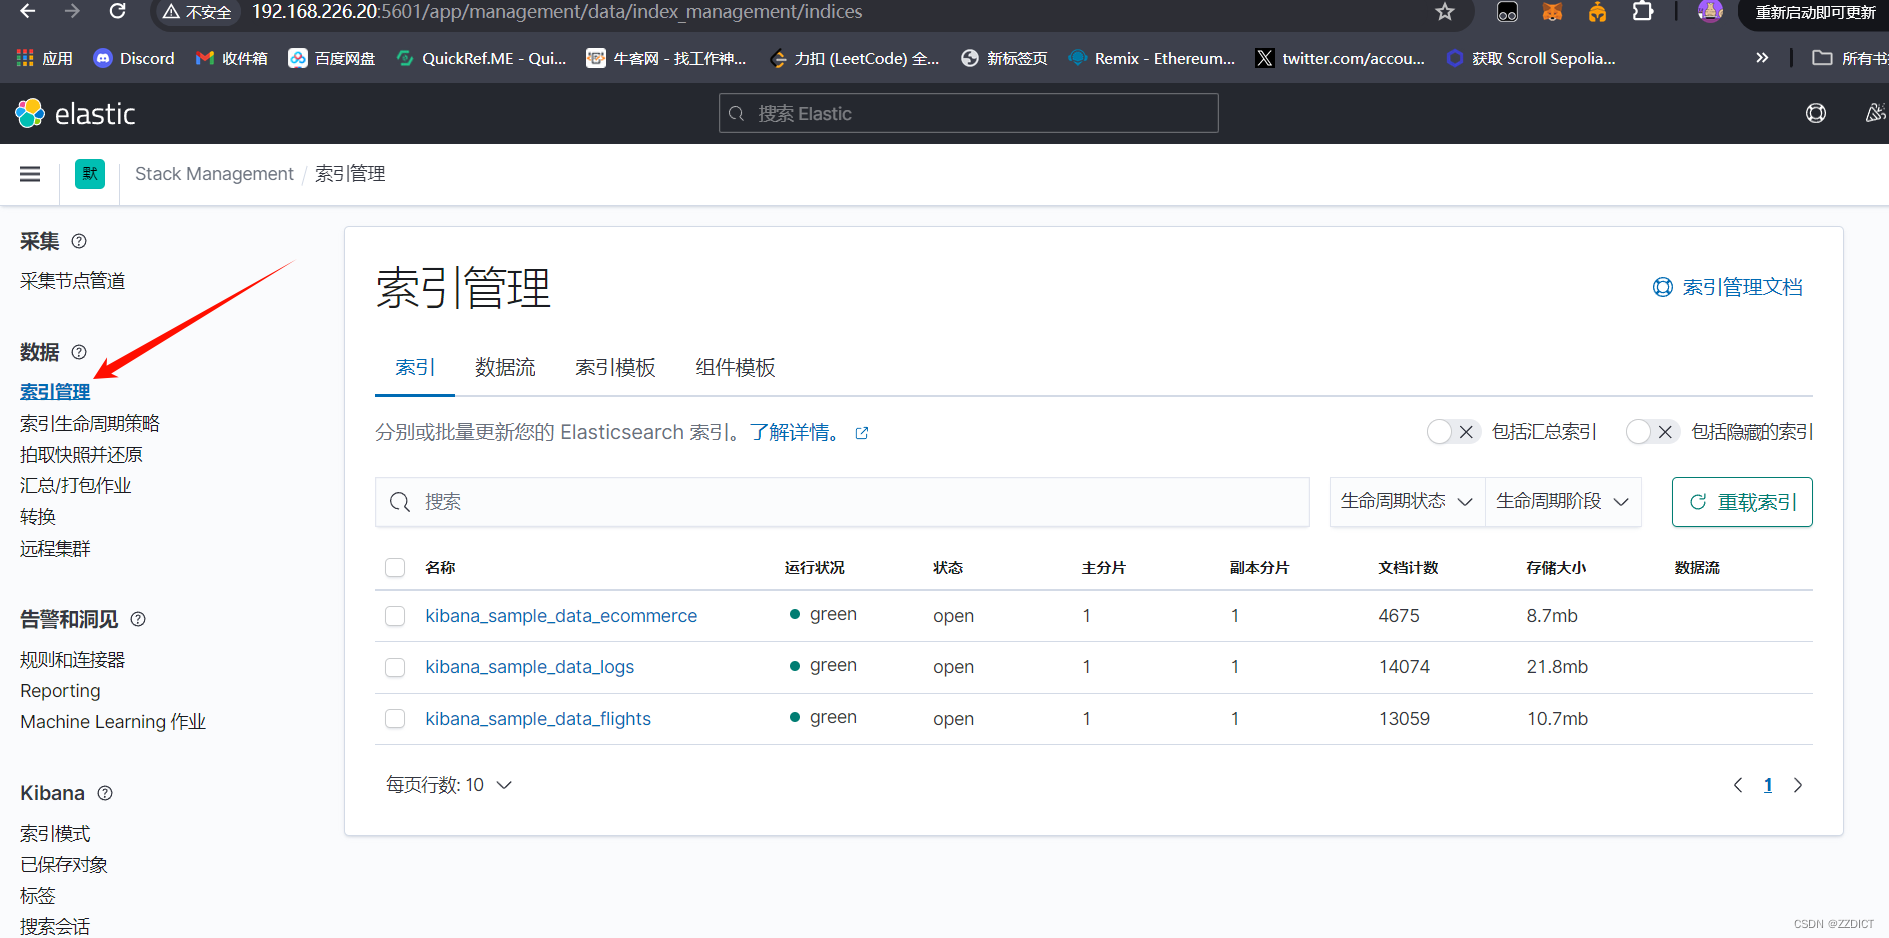
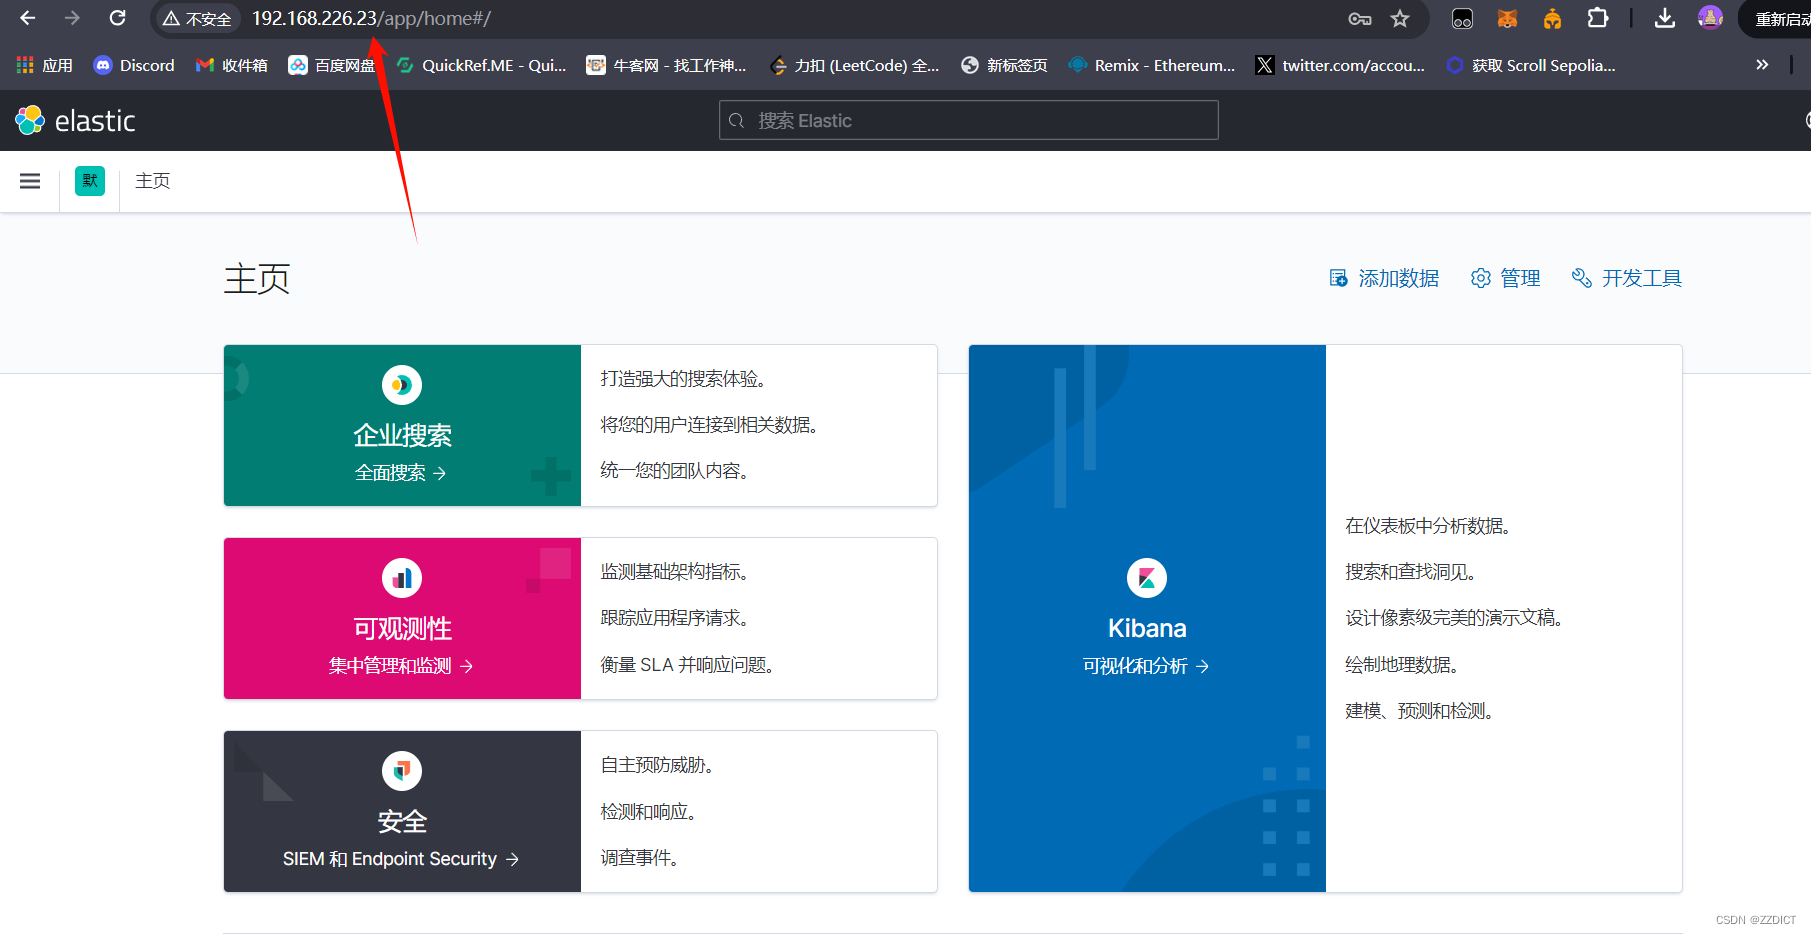
LISTEN 0 4096 *:9300 *:* users:(("java",pid=1716,fd=277)) 浏览器访问http://192.168.226.20:5601/app/home
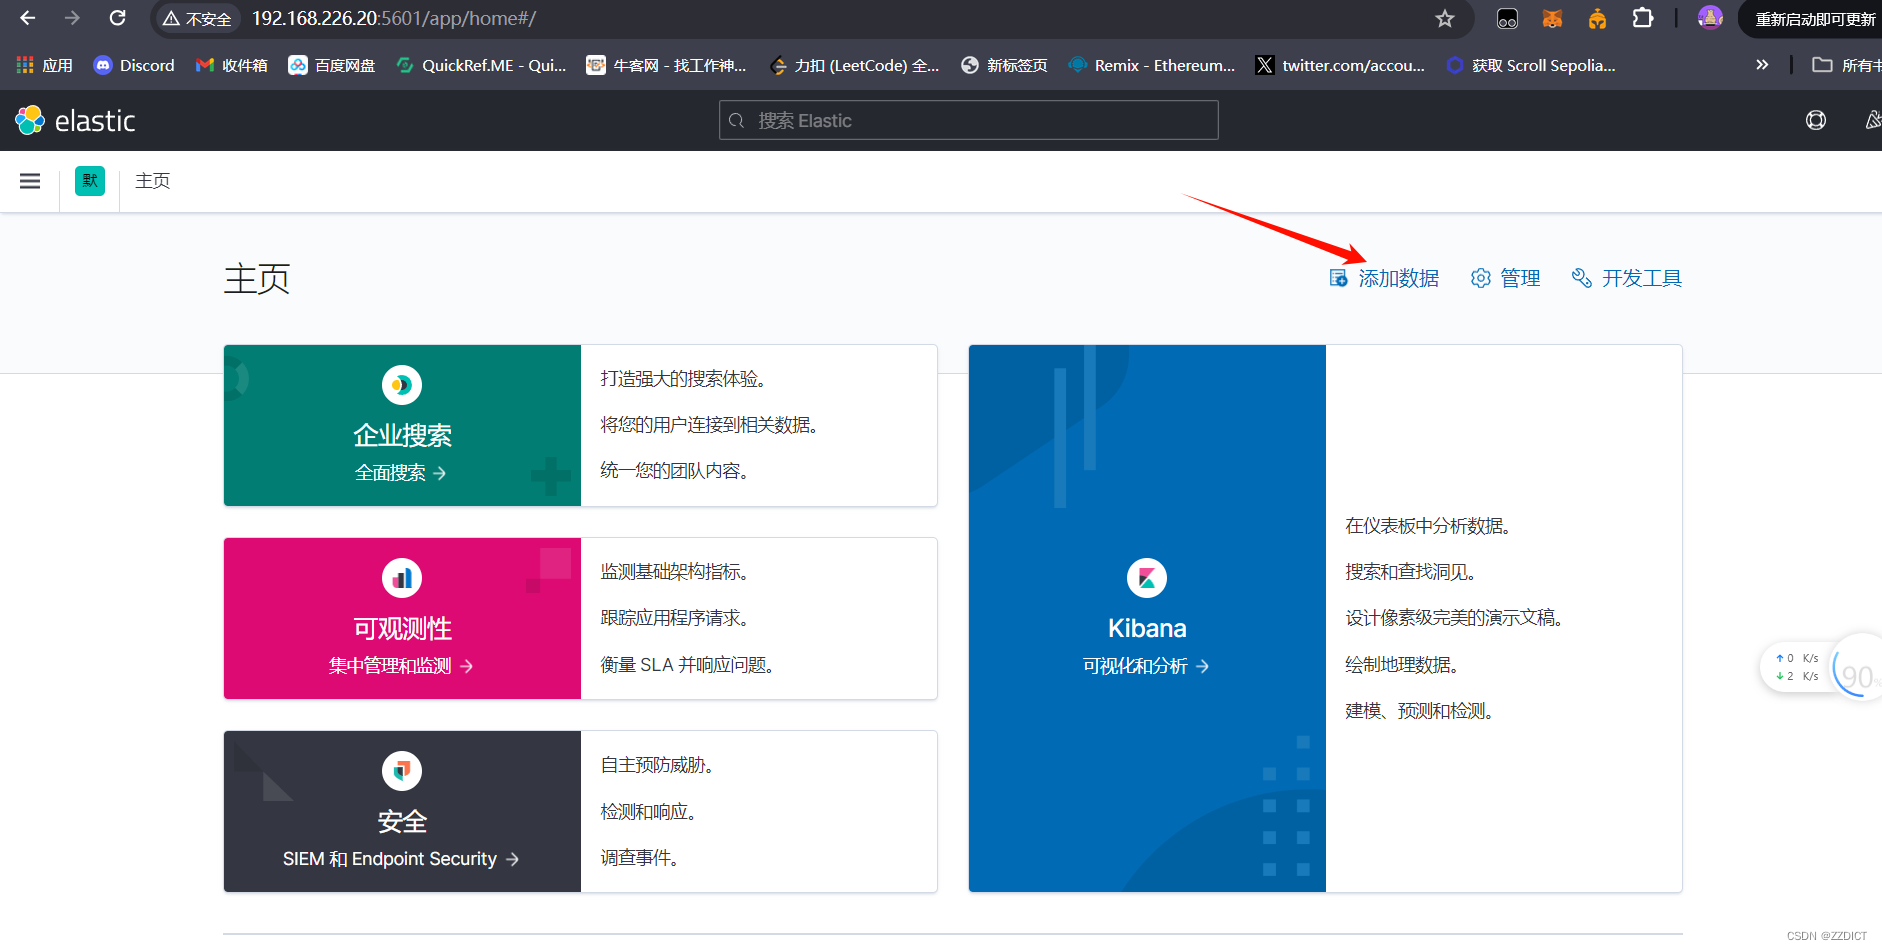
尝试浏览熟悉页面
五. 安装配置Nginx反向代理
新增一台虚拟机,进行时间同步,关闭selinux和防火墙,依旧可以用上方用的初始化脚本。
| 软件版本 | 主机名 | IP | 系统 | 系统配置 |
| Nginx | nginx | 192.168.226.23 | Rocky_linux9.4 | 2核2G |
修改主机名
[root@localhost ~]# hostnamectl set-hostname nginx
退出重新连接即可更新主机名
1. 安装nginx
[root@nginx ~]# yum install -y nginx httpd-tools

[root@nginx ~]# nginx -v
nginx version: nginx/1.20.1
注意:httpd-tools用于生成nginx认证访问的用户密码文件
2. 配置反向代理
删除该配置文件原有内容,更换为如下,需要注意的是你在使用下述配置时,其中有三处IP需要更改成你对应的IP
[root@nginx ~]# vim /etc/nginx/nginx.conf
user  nginx;
worker_processes  auto;
error_log  /var/log/nginx/error.log;
pid        /var/run/nginx.pid;
worker_rlimit_nofile 65535;

events {
    worker_connections  65535;
    use epoll;
}

http {
    include       mime.types;
    default_type  application/octet-stream;

    log_format  main  '$remote_addr - $remote_user [$time_local] "$request" '
                      '$status $body_bytes_sent "$http_referer" '
                      '"$http_user_agent" "$http_x_forwarded_for"';

    access_log  /var/log/nginx/access.log  main;
    server_names_hash_bucket_size 128;
    autoindex on;

    sendfile        on;
    tcp_nopush     on;
    tcp_nodelay on;

    keepalive_timeout  120;
    fastcgi_connect_timeout 300;
    fastcgi_send_timeout 300;
    fastcgi_read_timeout 300;
    fastcgi_buffer_size 64k;
    fastcgi_buffers 4 64k;
    fastcgi_busy_buffers_size 128k;
    fastcgi_temp_file_write_size 128k;

    #gzip模块设置
    gzip on; #开启gzip压缩输出
    gzip_min_length 1k;    #最小压缩文件大小
    gzip_buffers 4 16k;    #压缩缓冲区
    gzip_http_version 1.0;    #压缩版本(默认1.1,前端如果是squid2.5请使用1.0)
    gzip_comp_level 2;    #压缩等级
    gzip_types text/plain application/x-javascript text/css application/xml;    #压缩类型,默认就已经包含textml,所以下面就不用再写了,写上去也不会有问题,但是会有一个warn。
    gzip_vary on;
    #开启限制IP连接数的时候需要使用
    #limit_zone crawler $binary_remote_addr 10m;
    #tips:
    #upstream bakend{#定义负载均衡设备的Ip及设备状态}{
    #    ip_hash;
    #    server 127.0.0.1:9090 down;
    #    server 127.0.0.1:8080 weight=2;
    #    server 127.0.0.1:6060;
    #    server 127.0.0.1:7070 backup;
    #}
    #在需要使用负载均衡的server中增加 proxy_pass http://bakend/;
    server {
        listen       80;
        server_name  192.168.226.23;

        #charset koi8-r;

       # access_log  /var/log/nginx/host.access.log  main;
        access_log /var/log/nginx/access.log;

         location / {
             auth_basic "Kibana";   #可以是string或off,任意string表示开启认证,off表示关闭认证。
             auth_basic_user_file /etc/nginx/passwd.db;   #指定存储用户名和密码的认证文件。
             proxy_pass http://192.168.226.20:5601;
             proxy_set_header Host $host:5601;
             proxy_set_header X-Real-IP $remote_addr;
             proxy_set_header X-Forwarded-For $proxy_add_x_forwarded_for;
             proxy_set_header Via "nginx";
                     }
         location /status {
             stub_status on; #开启网站监控状态
             access_log /var/log/nginx/kibana_status.log; #监控日志
             auth_basic "NginxStatus"; }

         location /head/{
             auth_basic "head";
             auth_basic_user_file /etc/nginx/passwd.db;
             proxy_pass http://192.168.226.20:9100/;
             proxy_set_header Host $host:9100;
             proxy_set_header X-Real-IP $remote_addr;
             proxy_set_header X-Forwarded-For $proxy_add_x_forwarded_for;
             proxy_set_header Via "nginx";
                         }

        # redirect server error pages to the static page /50x.html
        error_page   500 502 503 504  /50x.html;
        location = /50x.html {
            root   html;
        }
    }
}
3. 配置授权用户和密码
[root@nginx ~]# htpasswd -cm /etc/nginx/passwd.db kibana
然后会提示你输入定义的密码,这里给kibana定义的密码是123456
4. 启动nginx
[root@nginx ~]# systemctl enable --now nginx浏览器访问 刚开始没有任何数据,会提示你创建新的索引。
访问会让输入用户名密码,即我们刚创建的 kibana 密码为123456
六. Logstash部署与测试
logstash使用和部署在nginx主机中,192.168.226.23
上传压缩包logstash-7.13.2-linux-x86_64.tar.gz这里我已经传输好了。
[root@nginx ~]# ll
total 352456
-rw-------. 1 root root       815 Jun  6 14:00 anaconda-ks.cfg
-rw-r--r--  1 root root 360899712 Jul  2 11:40 logstash-7.13.2-linux-x86_64.tar.gz
-rw-r--r--. 1 root root      4747 Jun 24 19:46 rocky_linux.sh
1. 安装
[root@nginx ~]# tar -zxf logstash-7.13.2-linux-x86_64.tar.gz -C /usr/local/2. 创建conf目录
[root@nginx ~]# mkdir /usr/local/logstash-7.13.2/conf
[root@nginx ~]# cd /usr/local/logstash-7.13.2/conf
3. 创建stdin.conf输入文件,创建stdout.conf输出文件
在这个两个输入输出配置文件中,先定义标准输入与输出的配置语句进行后续测试
[root@nginx conf]# vim stdin.conf      #写入配置保存退出
input {
	stdin {}
}


[root@nginx conf]# vim stdout.conf   #写入配置保存退出
output {
	stdout {
		codec => rubydebug
	}
}
4. 启动logstash
[root@nginx conf]# cd ..
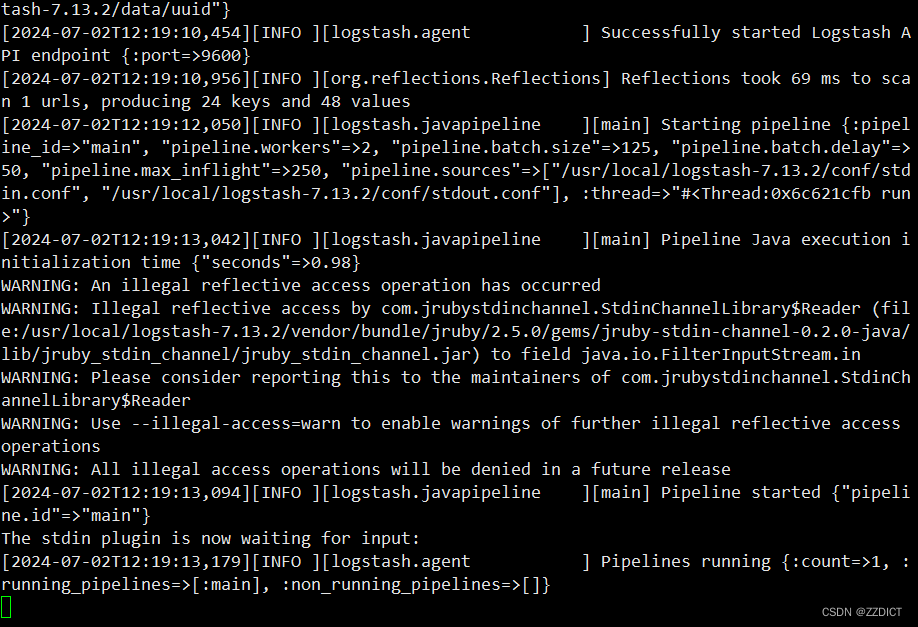
[root@nginx logstash-7.13.2]# ./bin/logstash -f conf/
-f或--config.file是 Logstash 命令行参数之一,用于指定 Logstash 配置文件的路径。这个参数告诉 Logstash 去哪里读取配置信息,以便按照这些配置启动和运行。
启动后稍微等待加载,如下图即为启动成功
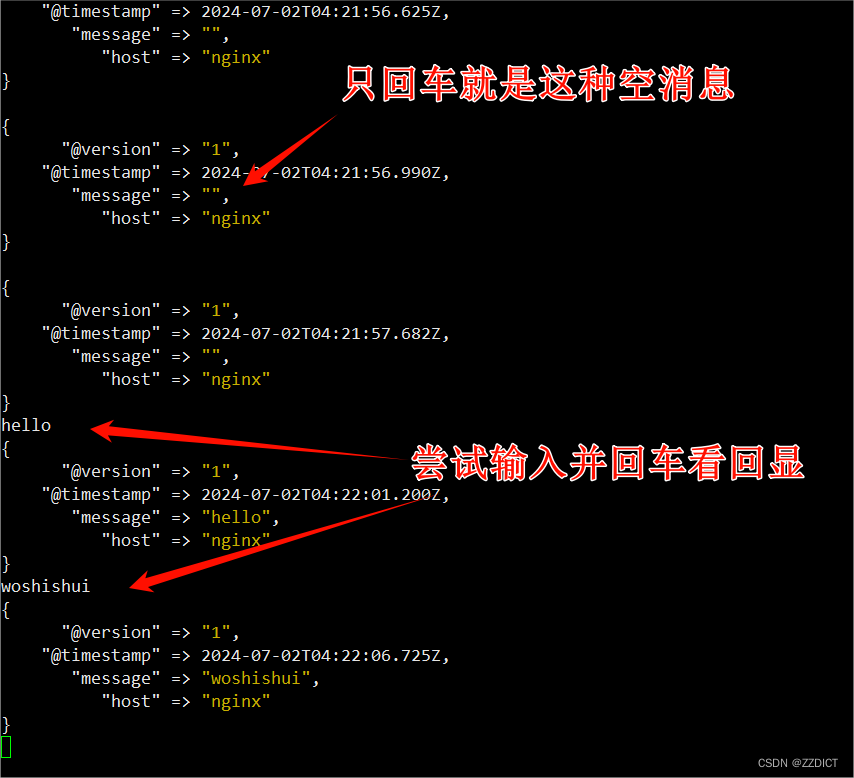
5. 测试标准输入=>标准输出
在上图终端里,尝试输入字符并回车,会得到回显

6. 修改输出配置stdout.conf文件,标准输出到es集群
按ctrl +c组合键先停止
然后编辑配置文件,配置语句里的IP即上方我们的三个es集群各自的IP,配置完后保存退出。
[root@nginx logstash-7.13.2]# vim conf/stdout.conf  #将该配置文件修改为如下内容
input {
	stdin {}
}
output {
	stdout {
		codec => rubydebug
	}
	elasticsearch {
      hosts => ["192.168.226.20","192.168.226.21","192.168.226.22"]
      index => 'logstash-debug-%{+YYYY-MM-dd}'
    }
}
7. 再次启动测试
[root@nginx logstash-7.13.2]# ./bin/logstash -f conf/
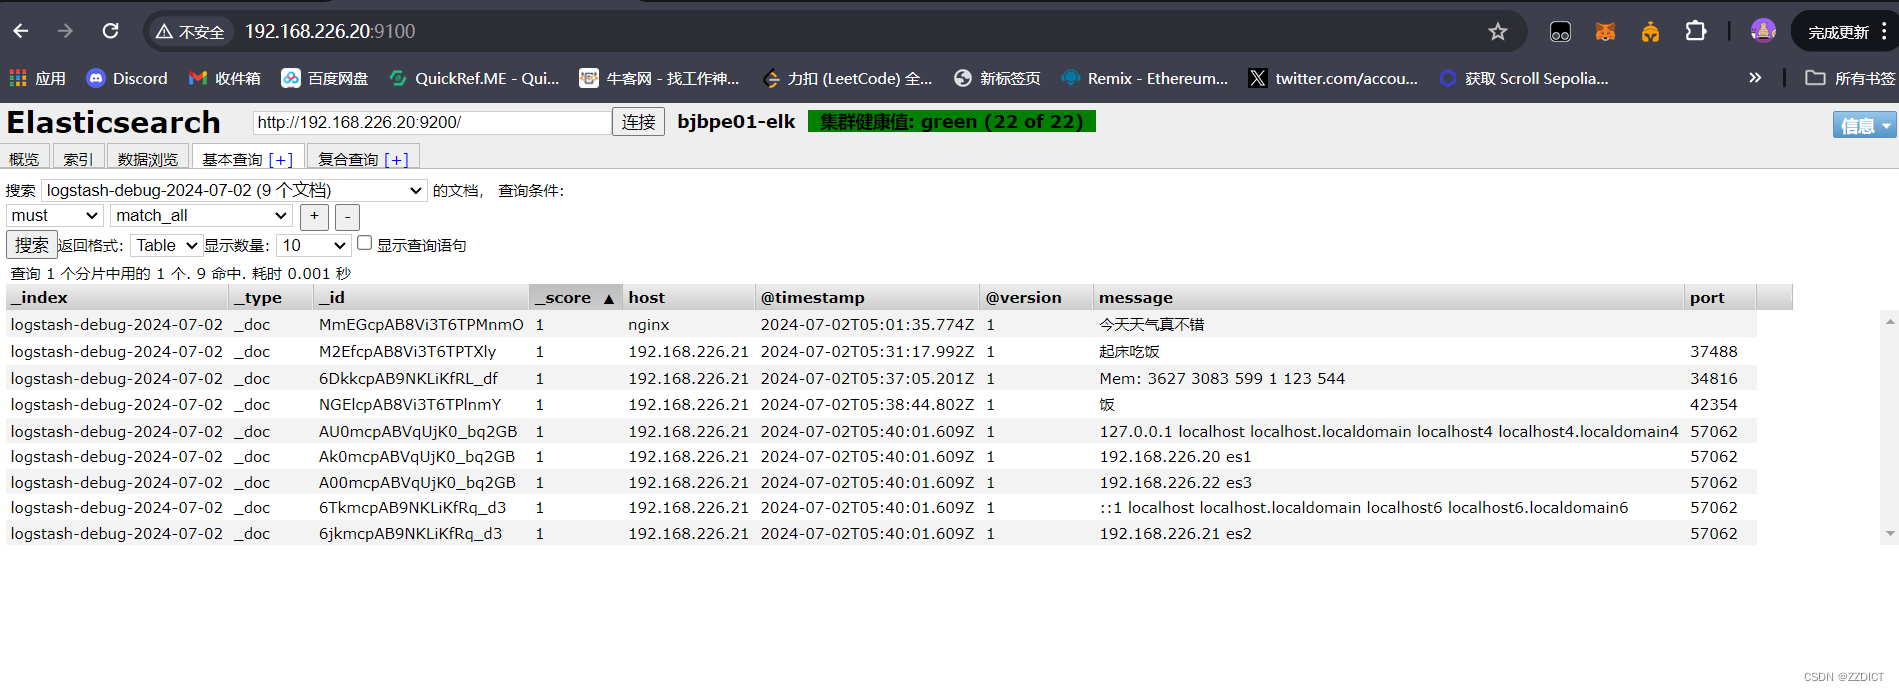
然后回到在Elasticsearch中一个Web界面,会出现刚刚加入的索引
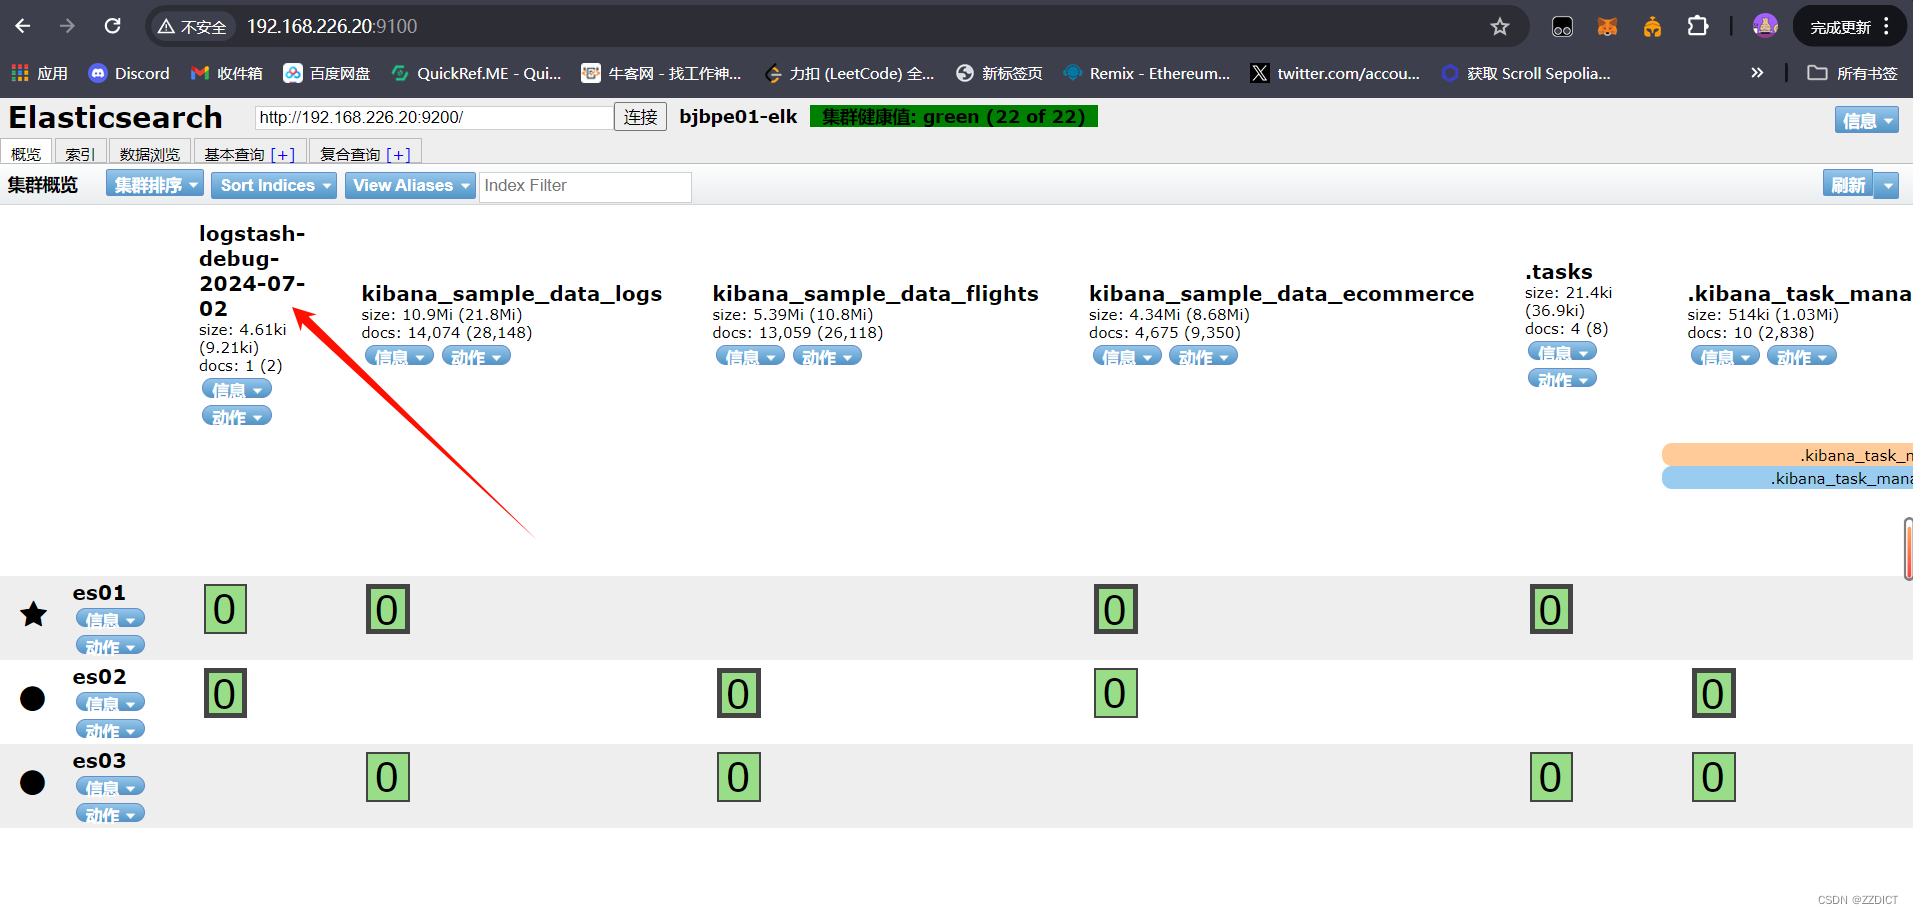
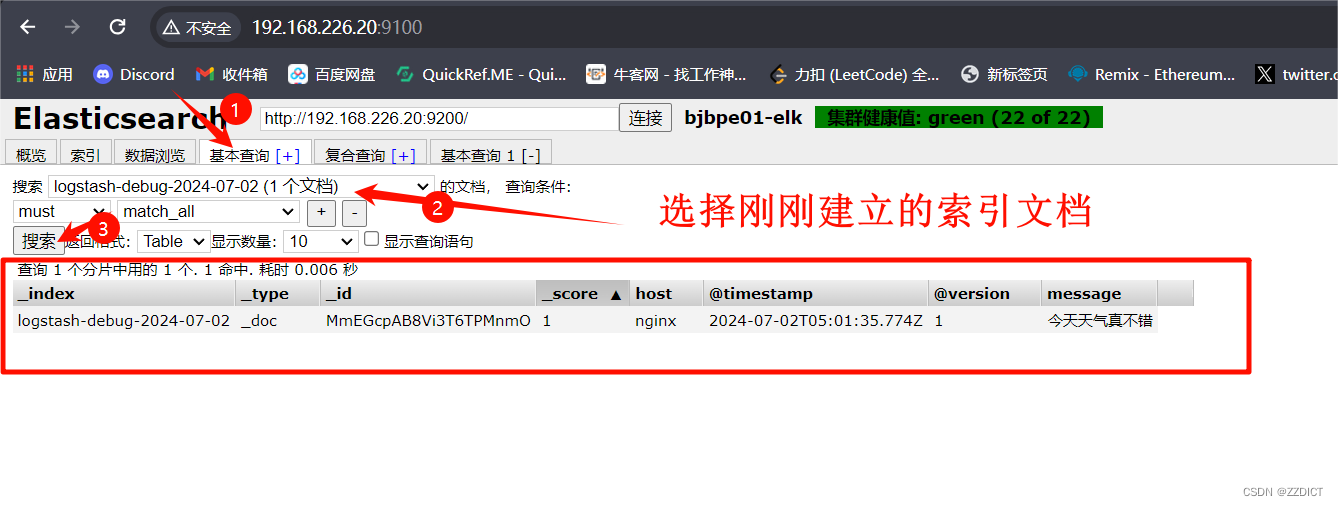 在这个elasticsearch集群监控页面就可以查看到输入信息了。
8. 修改输入配置stdin.conf文件,端口输入=>字段匹配=>标准输出及es集群
按ctrl +c组合键先停止
然后编辑配置文件,修改后保存退出
[root@nginx logstash-7.13.2]# vim conf/stdin.conf   #将该配置文件修改为如下内容
input {
	tcp {
		port => 8888
	}
}
9. 启动再次测试
[root@nginx logstash-7.13.2]# ./bin/logstash -f conf/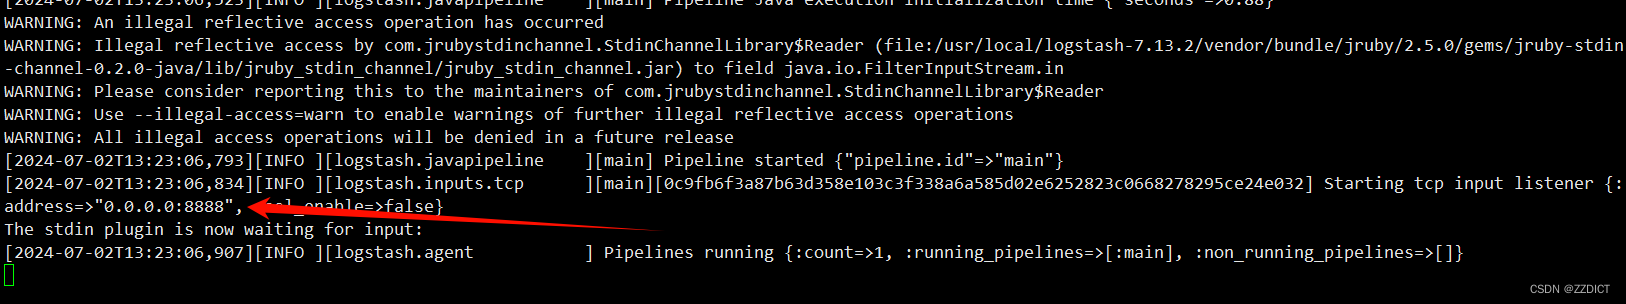
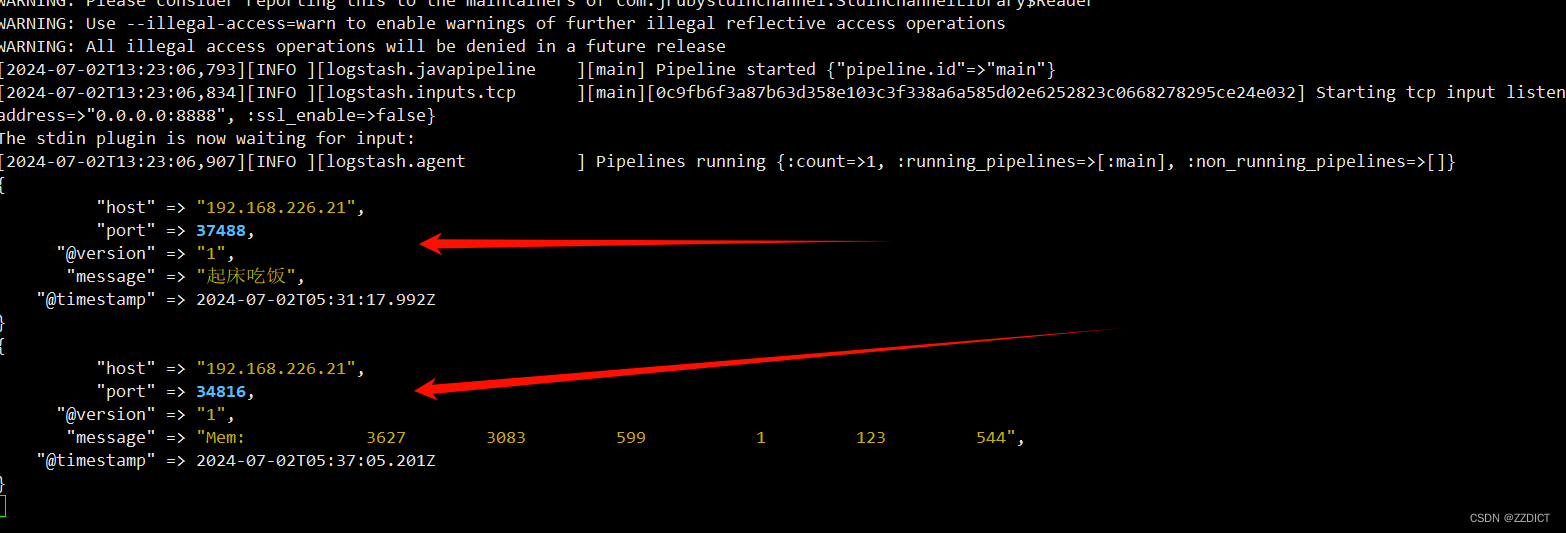
可以看到监听的端口已经变成我们设置的8888了
现在随便一台服务器,下载nc工具,这里我用192.168.226.21主机下载nc工具测试
[root@es2 ~]# yum install -y nc
#发送测试
[root@es2 ~]# echo "起床吃饭" | nc 192.168.226.23 8888
[root@es2 ~]# free -m | grep "Mem" | nc 192.168.226.23 8888
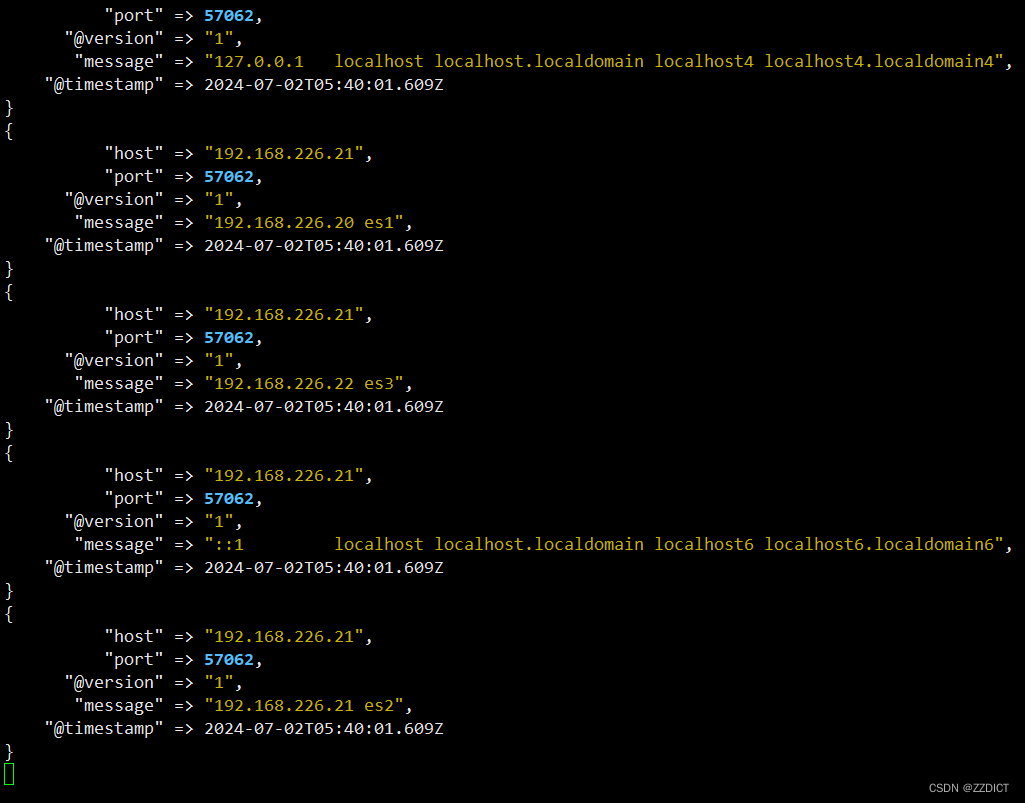
[root@es2 ~]# cat /etc/hosts | nc 192.168.226.23 8888
然后切换回192.168.226.23主机看输出如下:
10. 加入filebeat => 字段匹配 => 标准输出及es
按ctrl +c组合键先停止
然后编辑配置文件,修改后保存退出
[root@nginx logstash-7.13.2]# vim conf/stdin.conf #将该配置文件修改为如下内容
input {
tcp {
port => 8888
}
}
filter {
grok {
match => {"message" => "%{IPV4:cip}"}
}
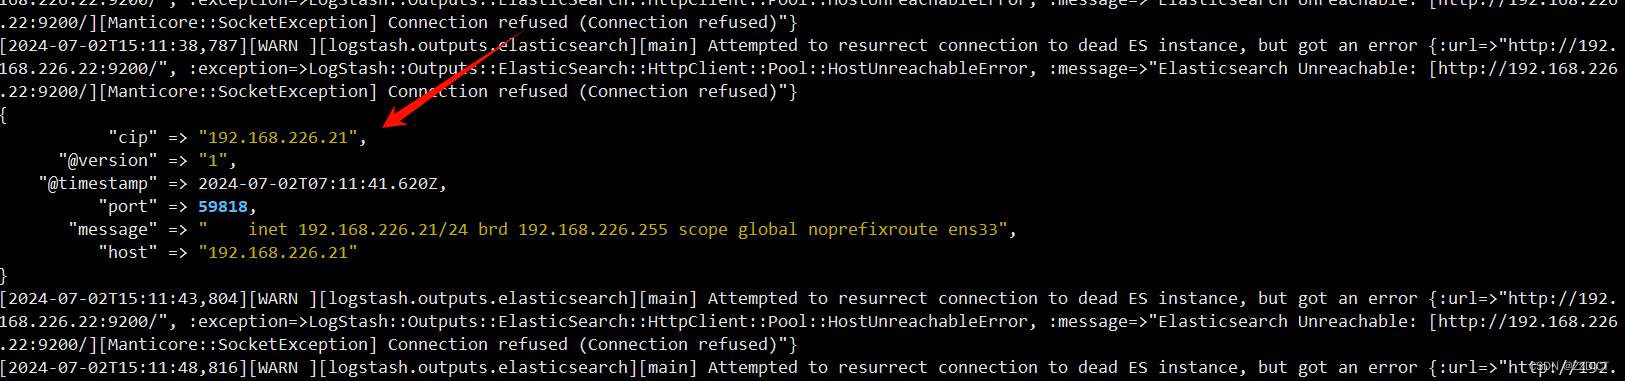
}11. 再次启动测试
[root@nginx logstash-7.13.2]# ./bin/logstash -f conf/用192.168.226.21主机发送测试
[root@es2 ~]# ip a | grep inet | grep ens33 | nc 192.168.226.23 8888
然后再看输出信息如图:
12. 将nginx的access.log文件导入创建索引
按ctrl +c组合键先停止
然后编辑配置文件,修改后保存退出
[root@nginx logstash-7.13.2]# vim conf/stdin.conf #将该配置文件修改为如下内容
input {
file {
path => "/var/log/nginx/access.log" # 更新为你的nginx access.log的实际路径
start_position => "beginning"
sincedb_path => "/dev/null"
ignore_older => 0
type => "nginx-access"
}
}
filter {
if [type] == "nginx-access" {
grok {
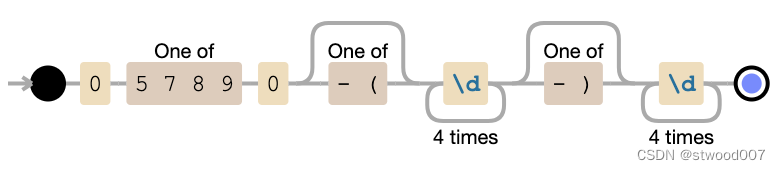
match => { "message" => "%{IP:clientip} - %{USERNAME:auth} \[%{HTTPDATE:timestamp}\] \"%{WORD:verb} %{DATA:request} HTTP/%{NUMBER:httpversion}\" %{NUMBER:response} (?:-|%{NUMBER:bytes}) \"%{DATA:referrer}\" \"%{DATA:agent}\"" }
}
date {
match => [ "timestamp" , "dd/MMM/yyyy:HH:mm:ss Z" ]
remove_field => [ "timestamp" ]
}
useragent {
source => "agent"
}
}
}[root@nginx logstash-7.13.2]# vim conf/stdout.conf #将该配置文件修改为如下内容
input {
stdin {}
}
output {
stdout {
codec => rubydebug
}
elasticsearch {
hosts => ["192.168.226.20","192.168.226.21","192.168.226.22"]
index => 'nginx_access_log-%{+YYYY-MM-dd}'
}
}
启动
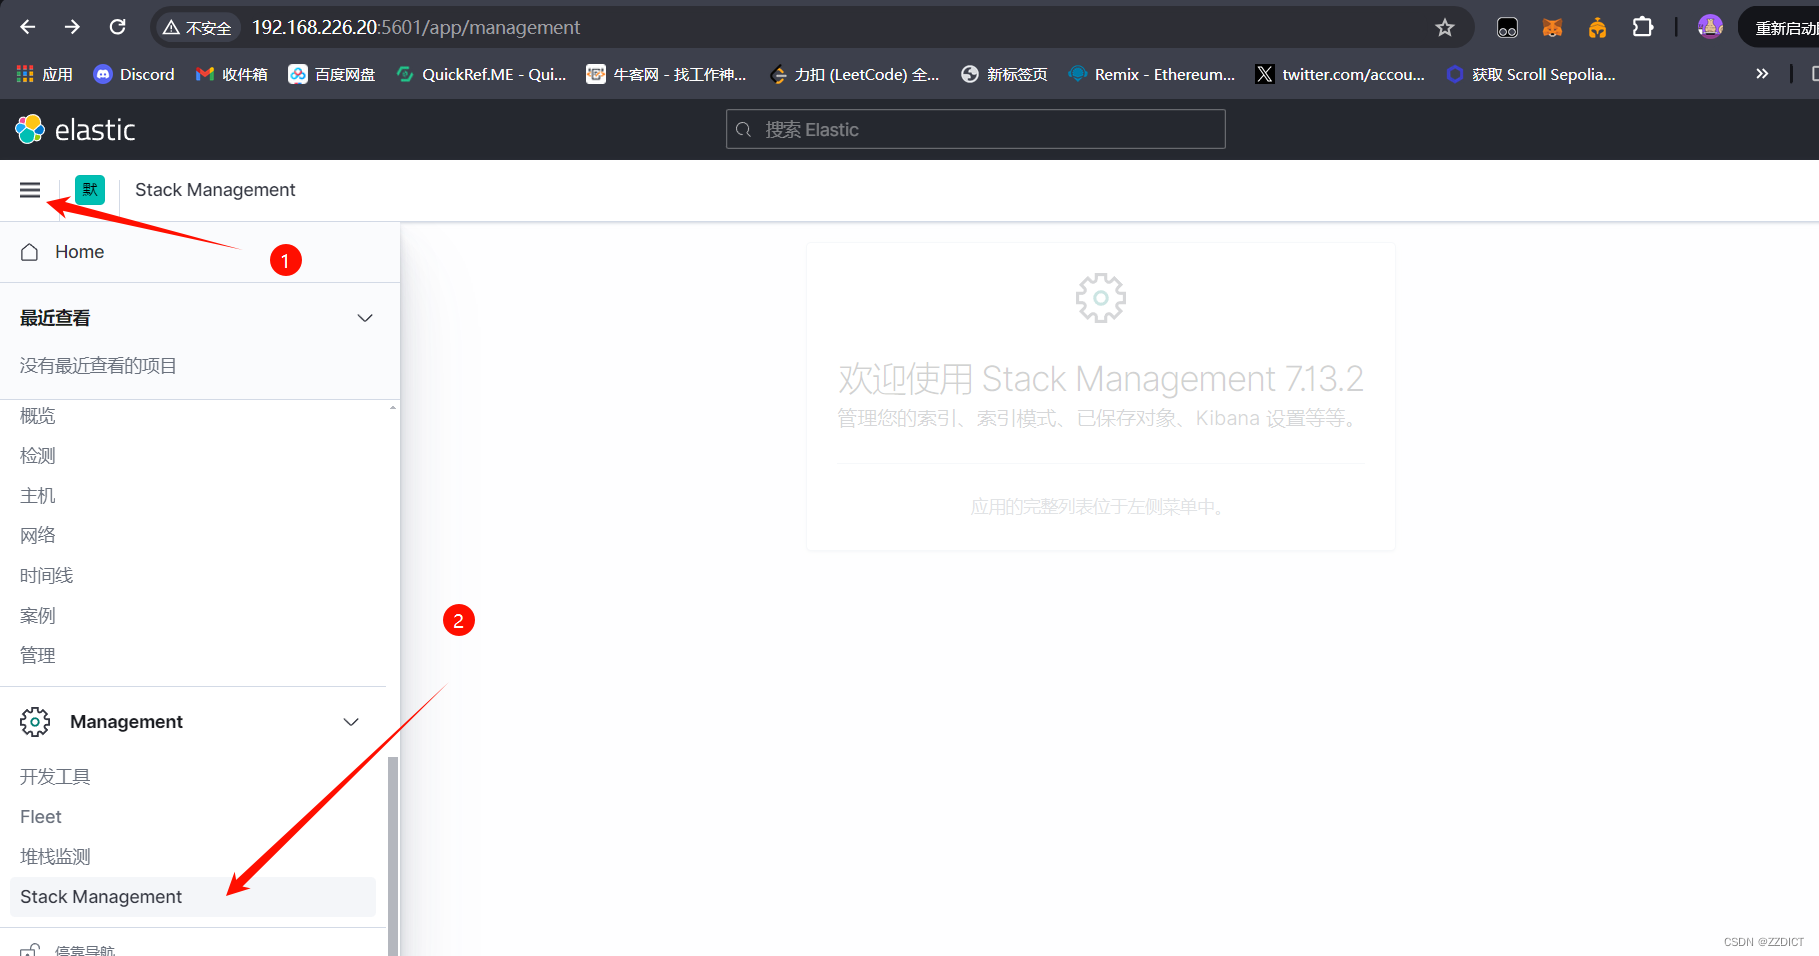
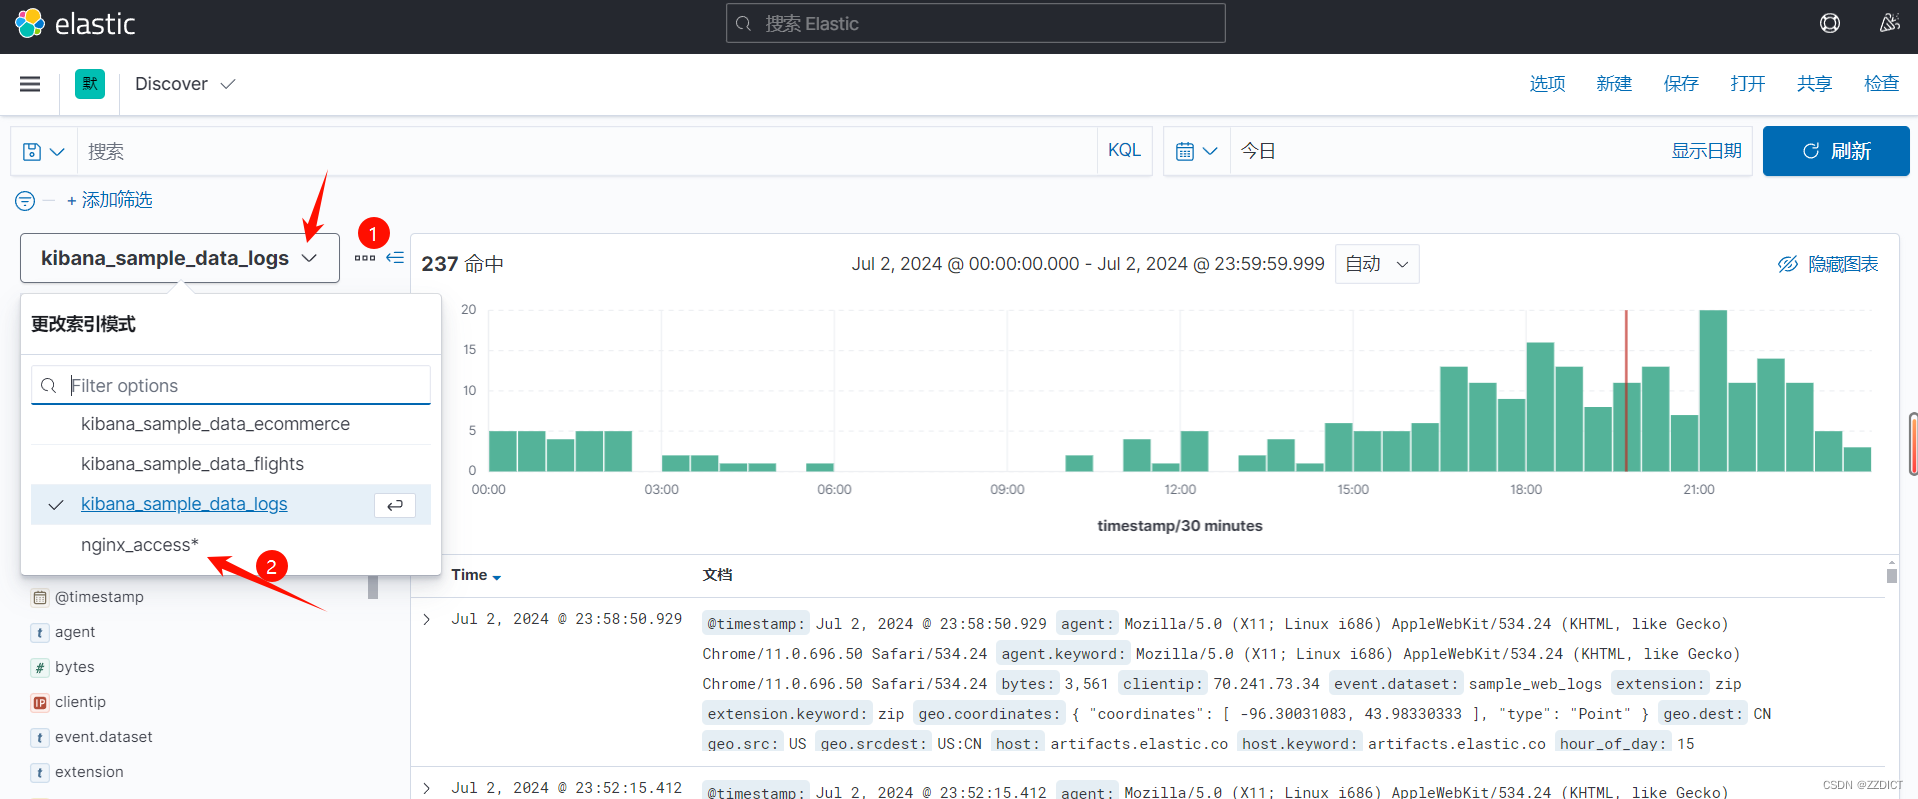
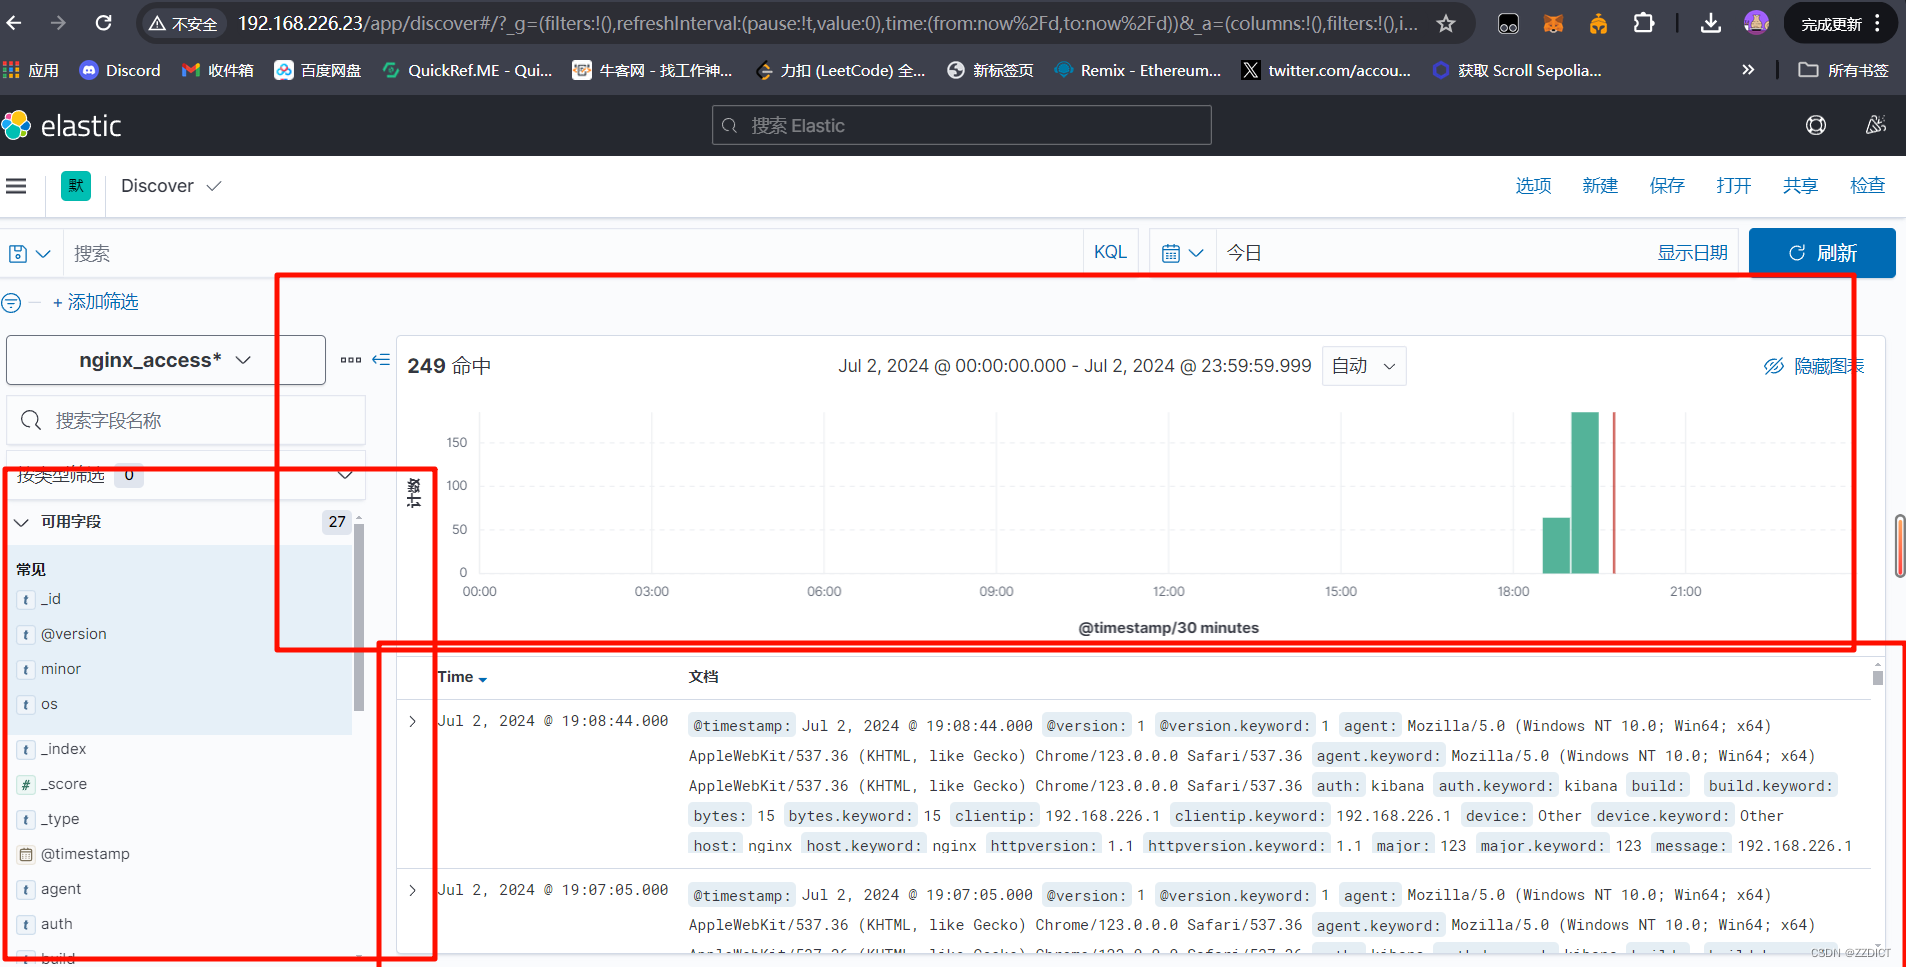
[root@nginx logstash-7.13.2]# ./bin/logstash -f conf/来到kibana页面,刷看找到更新后的索引
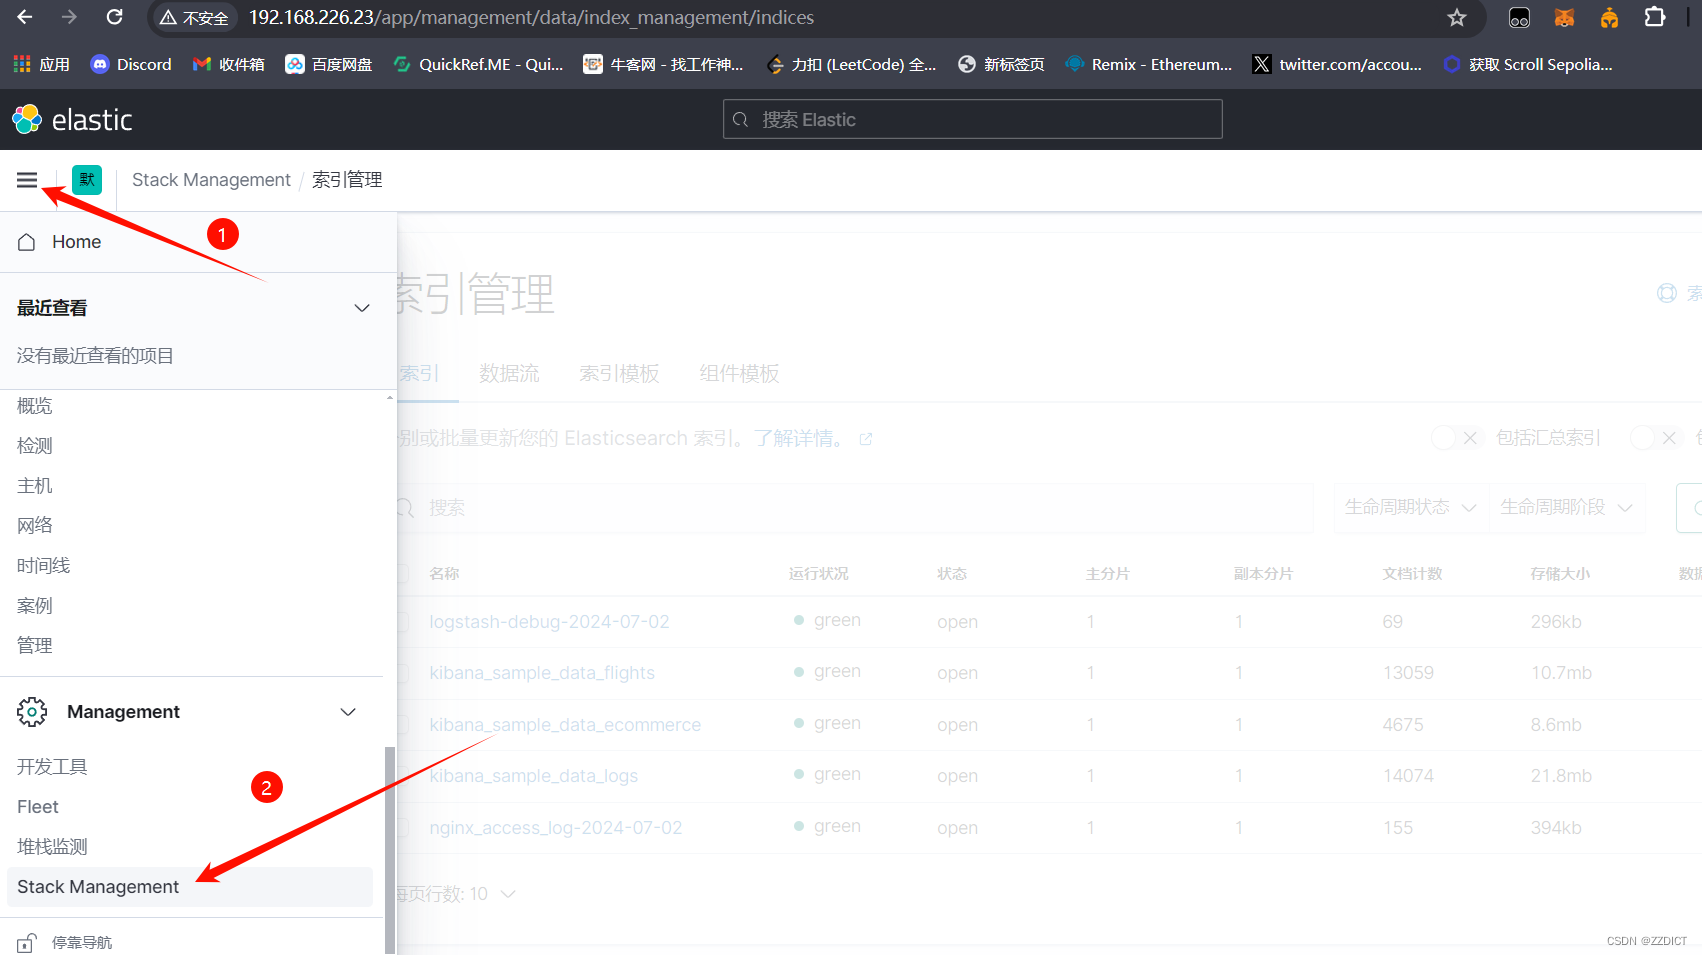
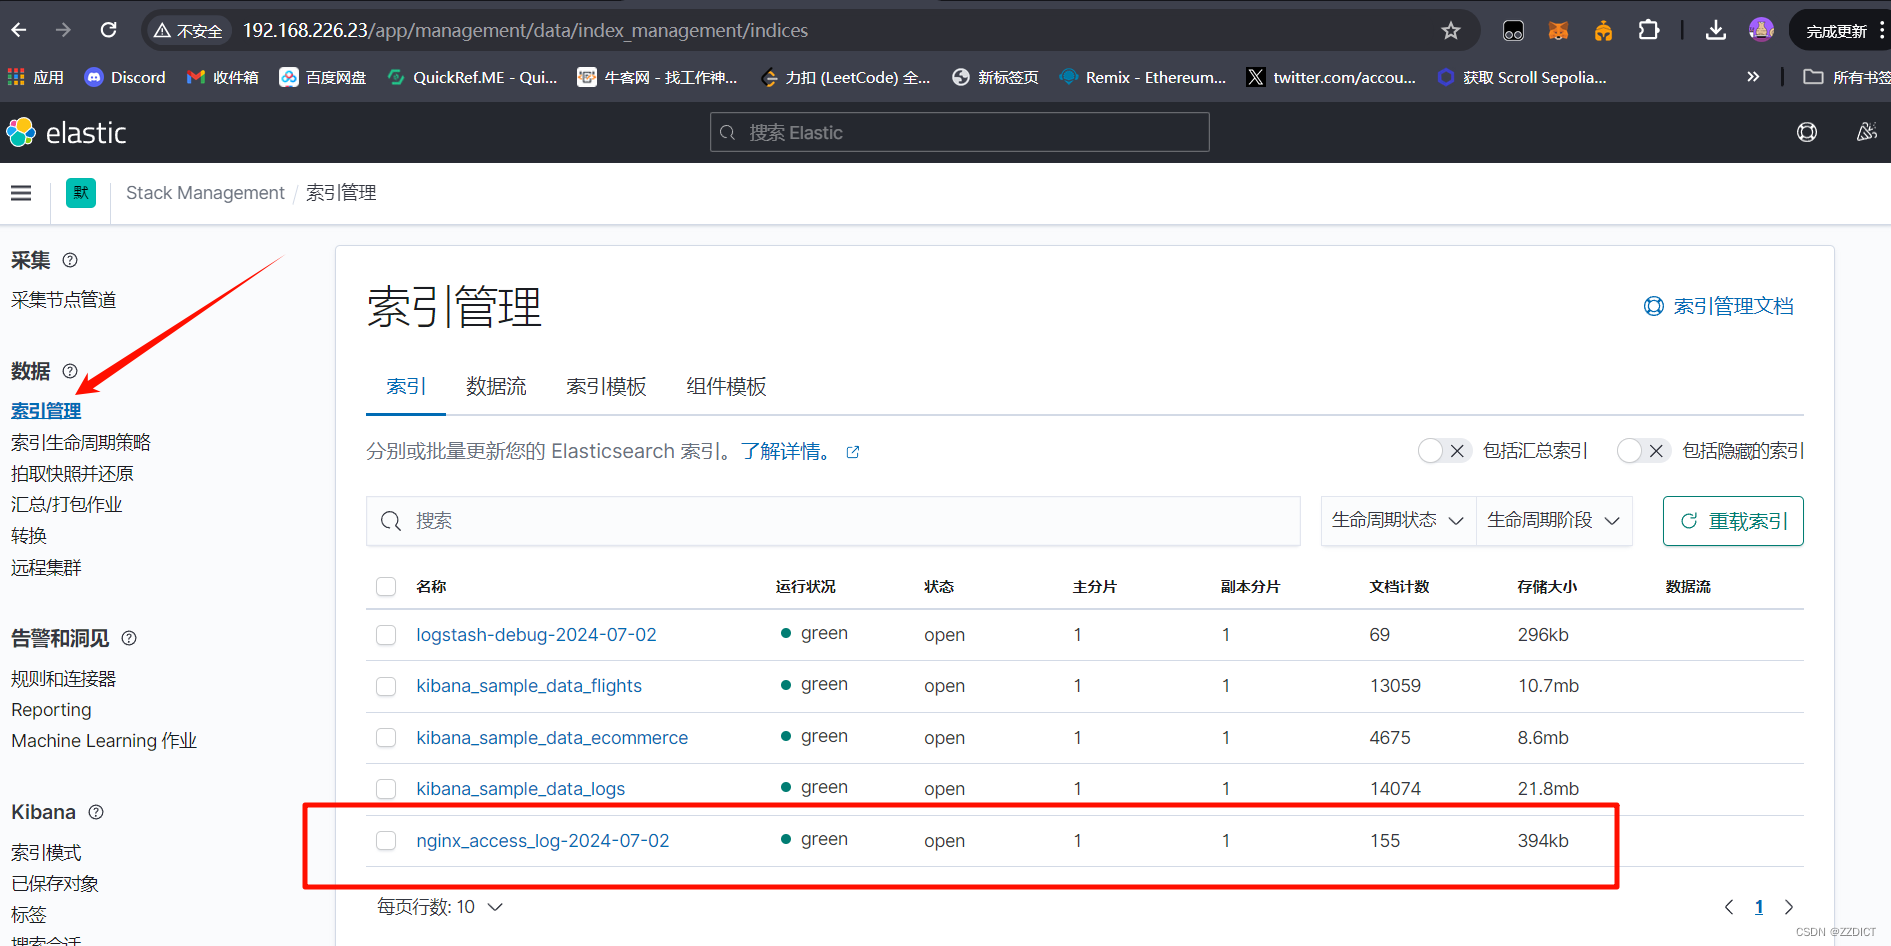
然后添加索引
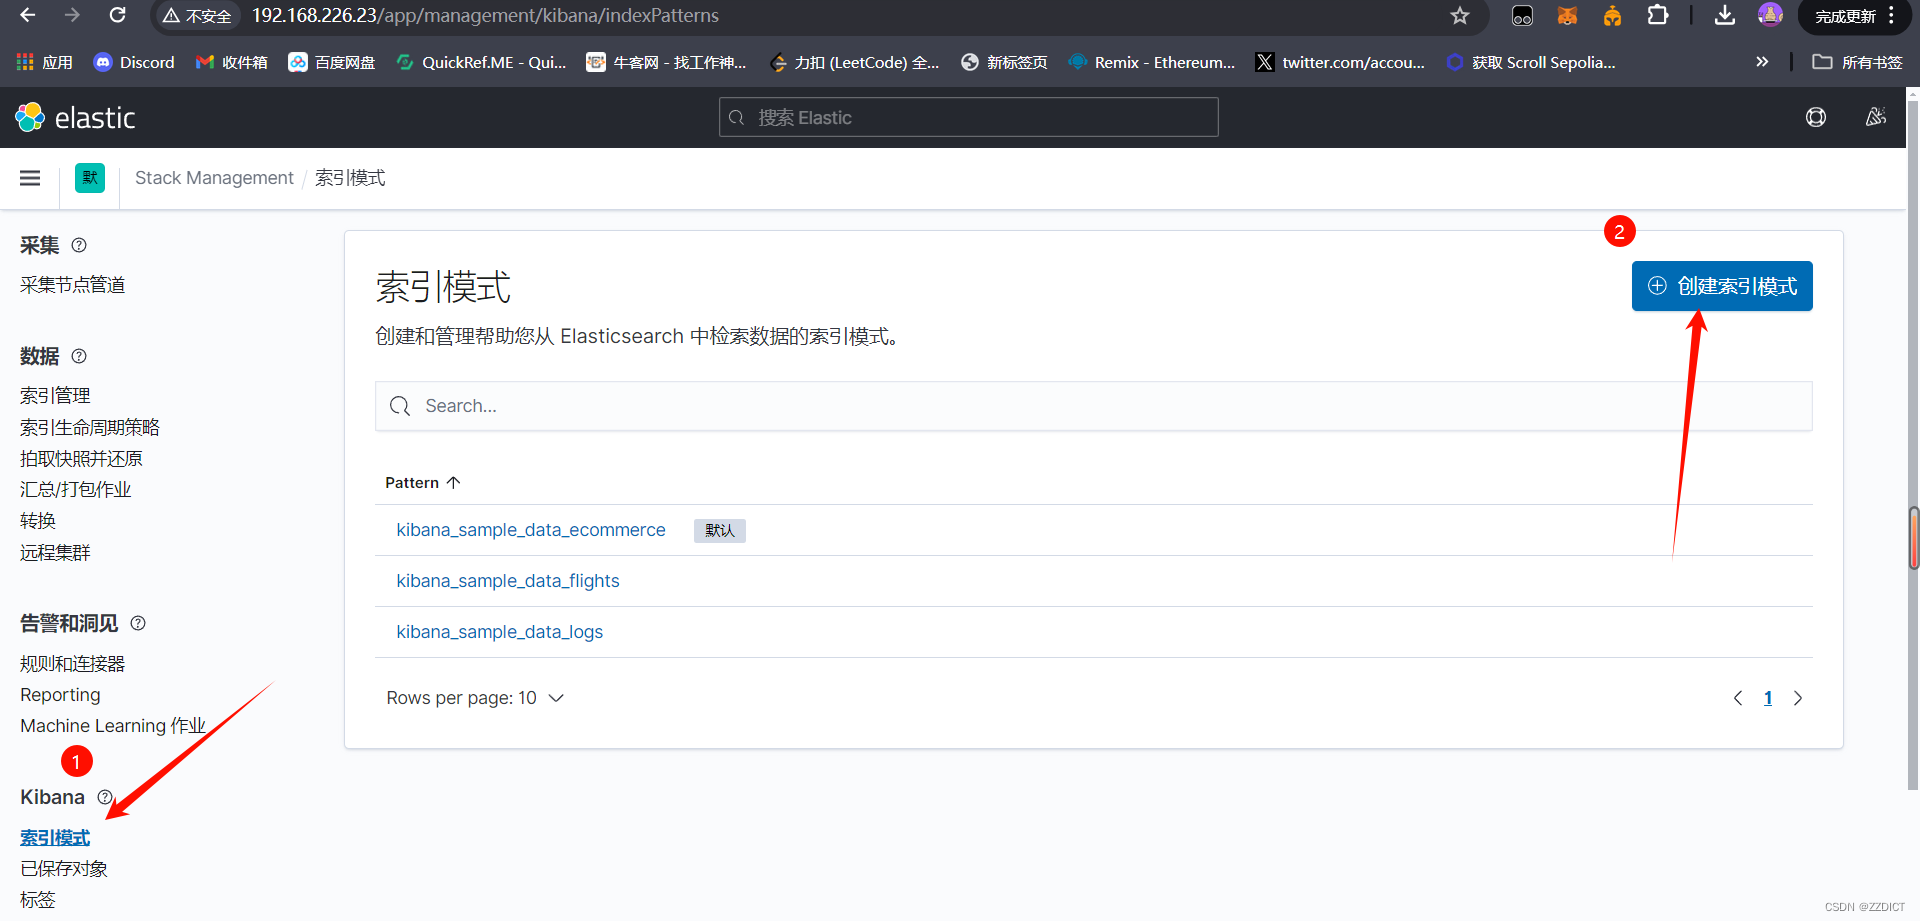
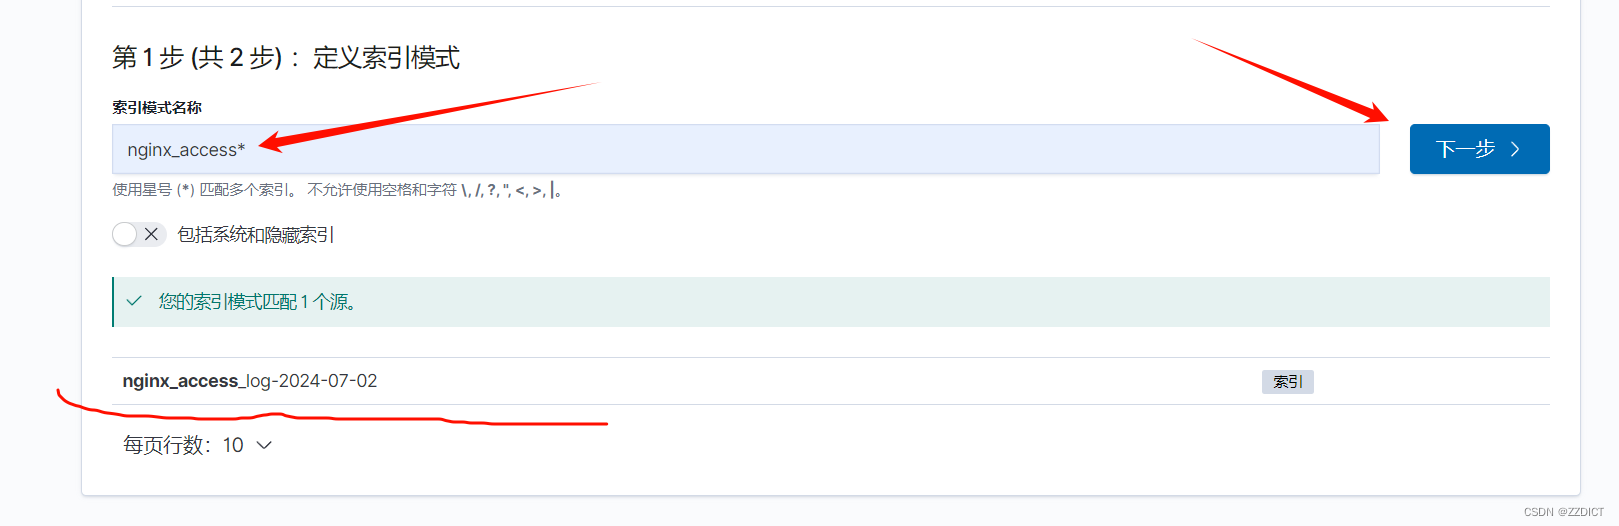

在Kibana中添加索引时,@timestamp 字段作为时间戳标识,不仅优化了数据的索引和查询性能,还为Kibana提供了强大的时间筛选和可视化功能。通过合理利用@timestamp字段,用户可以更高效地分析和理解基于时间的数据。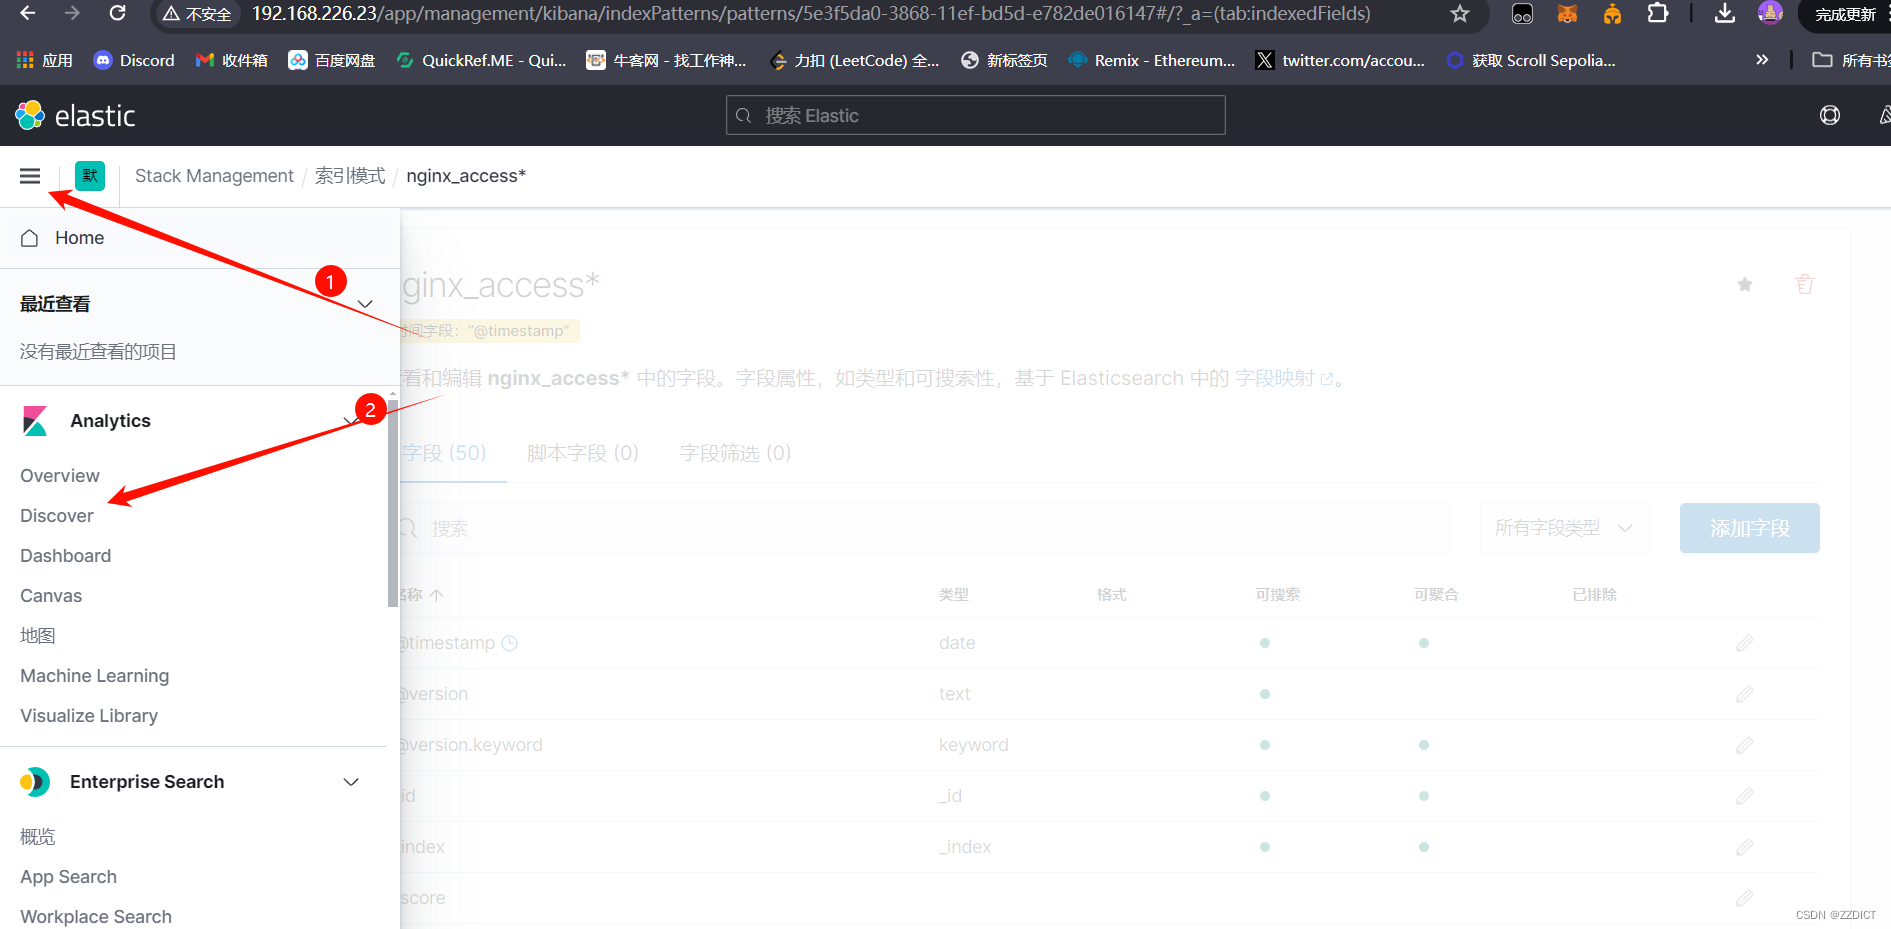
即通过这种修改配置文件,对 input , filter , input 的语句深度编写来改成我们需要的格式等。
关于Logstash更多资讯参考Logstash——grok-CSDN博客